Introduction
The Volume Weighted Moving Average (VWMA) is a powerful technical indicator that blends price and volume data to provide traders with a nuanced understanding of market trends.
Unlike traditional moving averages that treat all price points equally, the VWMA assigns greater weight to periods of high trading activity, making it particularly effective for identifying significant trends and momentum shifts.
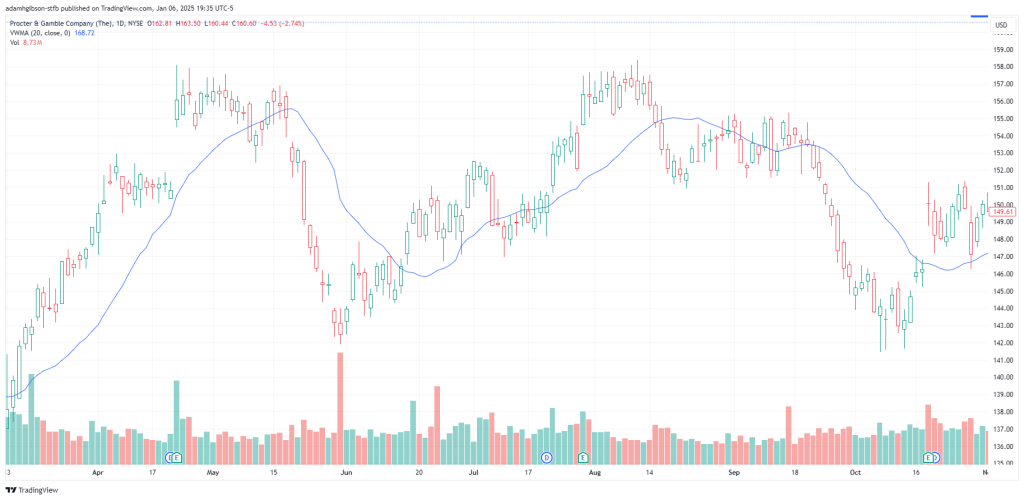 VWMA – Volume Weighted Moving Average
For traders who rely on volume data to validate price movements, the VWMA serves as an essential tool. It offers a more dynamic view of market sentiment, helping to refine entry and exit points.
By the end of this guide, you’ll have a clear understanding of how the VWMA works, its practical applications, and how to integrate it into your trading strategies.
What Is the VWMA Indicator?
The Volume Weighted Moving Average (VWMA) is a technical analysis tool that calculates an asset’s average price over a specified period, weighted by trading volume.
This ensures that price movements with higher volume have a greater impact on the average, providing a more accurate representation of market activity.
How it differs
The VWMA differs significantly from a Simple Moving Average (SMA), which gives equal weight to all price data. While SMAs are useful for general trend analysis, the VWMA offers deeper insights by highlighting the influence of trading volume on price trends.
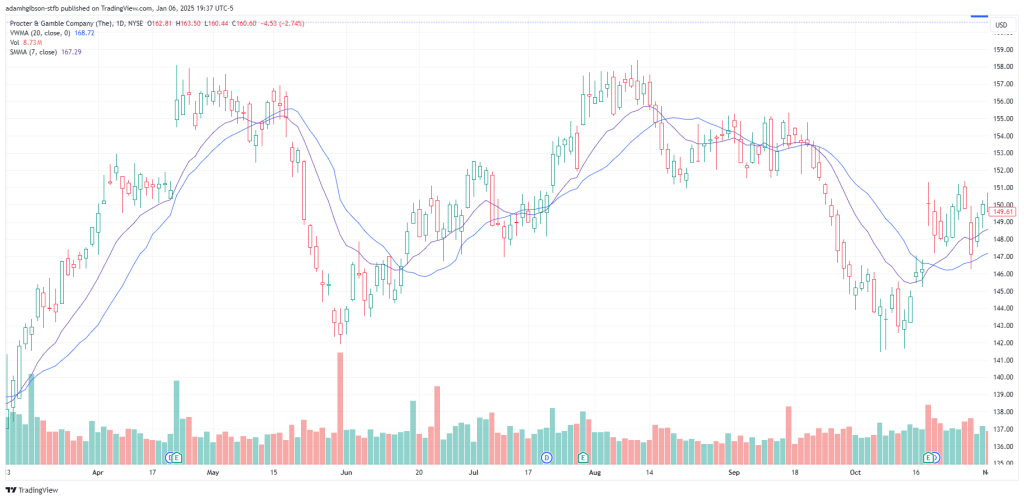 The VWMA (BLUE line) and SMA (PURPLE line) are paired side by side in this example. Something to notice is how the SMA is not directly affected by the volume of the stock, but rather indirectly affected as a byproduct of volume controlling price to an extent. Whereas, the VWMA reacts by directly taking volume into account, making this tool more useful in situations where volume is a big part of your strategy. This becomes less effective in less volatile markets.
This makes the VWMA particularly useful in volatile markets or when trading assets with irregular volume patterns.
How Does the VWMA Work?
The VWMA calculation involves multiplying the price of each period by its corresponding volume, summing these values, and then dividing by the total volume for the selected period. The formula is expressed as:

By incorporating volume data, the VWMA adapts to the strength of market participation. For example, a price spike accompanied by high volume will have a more significant impact on the VWMA than a similar price movement on low volume.
Difference between VWAP and VWMA?
It’s important to differentiate between the VWMA and the Volume Weighted Average Price (VWAP). While both indicators incorporate volume, the VWAP resets daily and is primarily used for intraday analysis.
The VWMA, on the other hand, is a continuous moving average, making it suitable for analyzing more consistent trends over longer timeframes.
Using the VWMA in Trading
Traders can add the VWMA to their charts through most trading platforms (I personally use and recommend using tradingview.com for your charting), where it can be customized for various timeframes. Shorter periods create a more responsive VWMA, suitable for intraday traders, while longer periods offer a smoother trend line for swing or position traders.
VWMA Buy Signals
The VWMA is especially useful for identifying buy and sell signals. When the price moves above the VWMA, it indicates bullish momentum, signaling a potential buying opportunity.
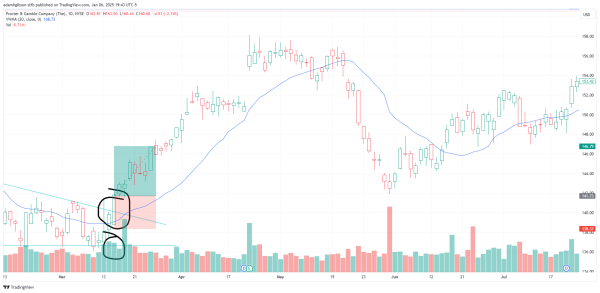 Here, we see the VWMA on the chart, indicated by the BLUE line. I have circles showing where price crossed above the VWMA, top line of the falling wedge, and volume increase. We set our Stop Loss right below the VWMA and plug in a 1.5:1 Risk/ Reward ratio.
VWMA Sell Signals
Conversely, when the price falls below the VWMA, it suggests bearish momentum, highlighting a possible selling opportunity.
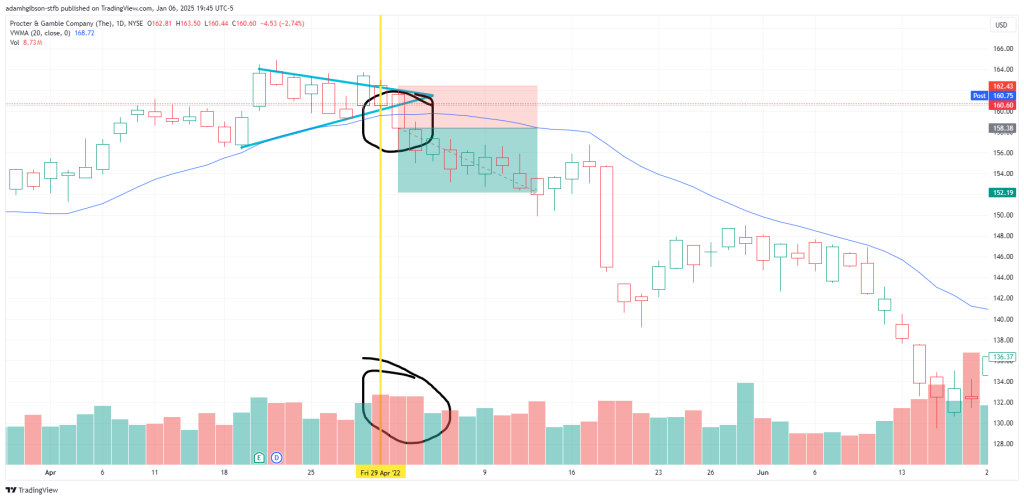 Here we see the bottom line of the triangle broken, bearish volume increase, price breaking below the VWMA and in this case, the VWMA is real close to price at this break, so we’ll give our trade some room to breathe and set out Stop Loss right before our pattern top line and win the trade.
Confluence VWMA with MACD
To improve accuracy, many traders combine the VWMA with complementary indicators such as the Relative Strength Index (RSI) or Moving Average Convergence Divergence (MACD).
For instance, a bullish crossover on the MACD that coincides with the price moving above the VWMA strengthens the signal for a long position.
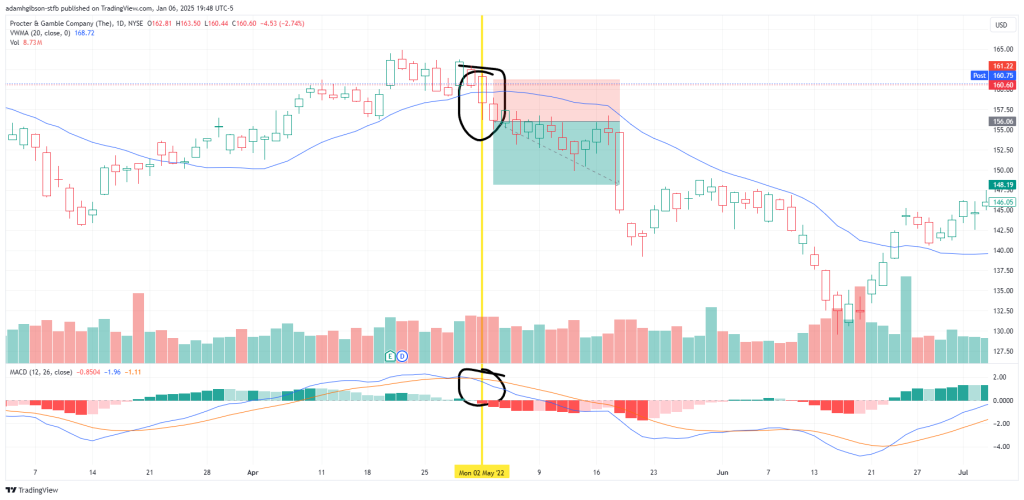 We have the MACD and VWMA on our chart. Price broke below VWMA as well as a cross on our MACD lines with good momentum reading on the MACD histogram. Allowing us to get into a good bearish trade, setting our Stop Loss right before the VWMA and eventually leaving this trade with a decent profit.
VWMA Trading Strategies
Using the VWMA in trading requires a structured approach. Traders often start by analyzing the price’s relationship with the VWMA. In a bullish trend, the price typically remains above the VWMA, with pullbacks toward the line offering potential buying opportunities.
In contrast, during a bearish trend, the price stays below the VWMA, and rallies toward it can signal selling opportunities.
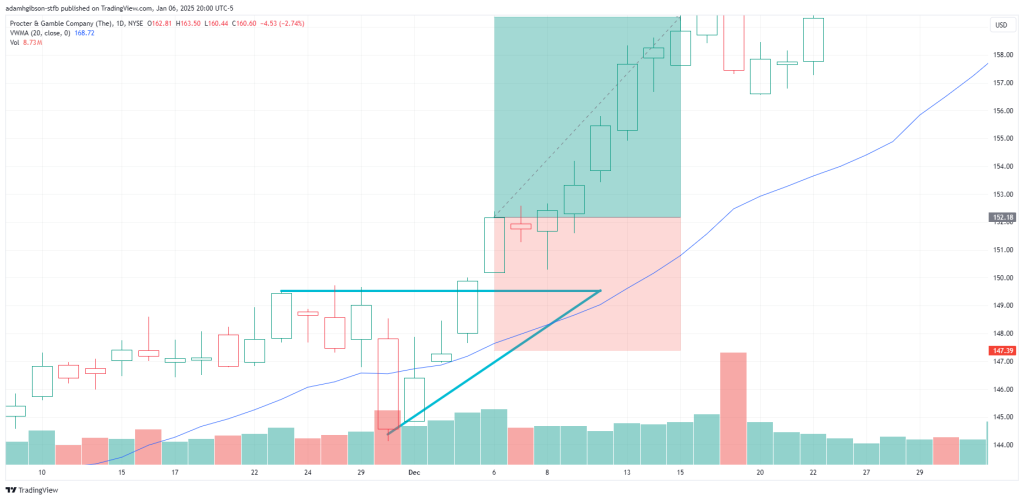 You can see that after deciding to enter this trade, we set our Stop Loss right before the VWMA, in order to give us a good point of cutting our losses based on a moving average calculated on volume.
For example, consider a scenario where the price briefly dips below the VWMA during a strong uptrend but quickly rebounds. This rebound can be a signal to enter a long position. To manage risk, traders can place a stop-loss order just below the VWMA to protect against unexpected reversals.
Similarly, during a downtrend, a failure to break above the VWMA after a short rally can confirm bearish momentum, presenting a short-selling opportunity.
Setting take-profit targets often involves analyzing nearby support and resistance levels or employing tools like Fibonacci retracements. The VWMA itself can act as a dynamic support or resistance level, helping traders adjust their targets based on evolving market conditions.
Benefits and Limitations of VWMA
The VWMA offers several advantages that make it a valuable tool for technical analysis. Its incorporation of volume data provides a more accurate reflection of market sentiment than traditional moving averages. This feature makes it particularly effective in identifying strong trends and filtering out noise in volatile markets.
Additionally, the VWMA’s adaptability to different timeframes and trading styles makes it a versatile indicator for a wide range of traders.
However, the VWMA is not without limitations. In low-volume markets, the reliability of the indicator decreases, as price movements with minimal trading activity can disproportionately affect the calculation.
Traders can mitigate these limitations by combining the VWMA with other indicators and maintaining a disciplined approach to risk management. Recognizing the conditions in which the VWMA excels allows traders to use it more effectively.
Critical Points
The VWMA is a sophisticated yet accessible tool for analyzing price trends and market momentum. By weighting prices based on volume, it provides a more nuanced view of market activity, helping traders identify key opportunities and avoid common pitfalls.
While the VWMA has its limitations, integrating it with complementary indicators and applying it within a robust trading strategy can enhance its effectiveness.
Whether you’re a day trader or a swing trader, the VWMA offers insights that can refine your approach to the markets and improve your decision-making.