Introduction: What is the SMA Indicator?
The Simple Moving Average (SMA) is one of the most widely used tools in stock trading, particularly by beginners and seasoned traders alike. At its core, the SMA is a technical indicator that calculates the average price of a stock over a specified number of periods, smoothing out short-term fluctuations to provide a clearer picture of the stock’s trend. This makes it an invaluable tool for identifying potential entry and exit points in the market.
SMA works by summing up the closing prices of a stock over a set number of days and then dividing by that number of days. For example, a 50-day SMA averages the closing prices of the last 50 trading days.
Traders use the SMA to identify trends, gauge market momentum, and spot possible reversals. Its simplicity, reliability, and ease of use make it an essential tool in any trader’s toolkit.
One practical application of the SMA indicator is using price crosses—when the stock price crosses above or below the SMA—to signal potential buy or sell opportunities. When coupled with other indicators like the Moving Average Convergence Divergence (MACD), the SMA becomes even more powerful for trend trading strategies.
How Does the SMA Indicator Work?
The SMA indicator calculates the average price of a stock over a specific time period, providing a smooth line on a stock chart that represents the stock’s trend. Here’s how it works in more detail:
Data Collection: The SMA takes a specific number of recent closing prices, such as 20, 50, or 150 periods, depending on the trader’s preference.
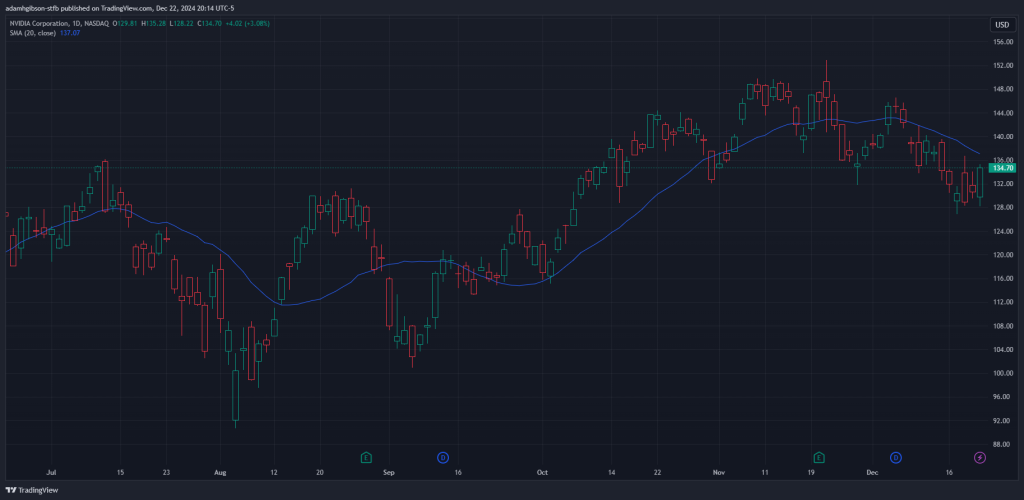 SMA 20
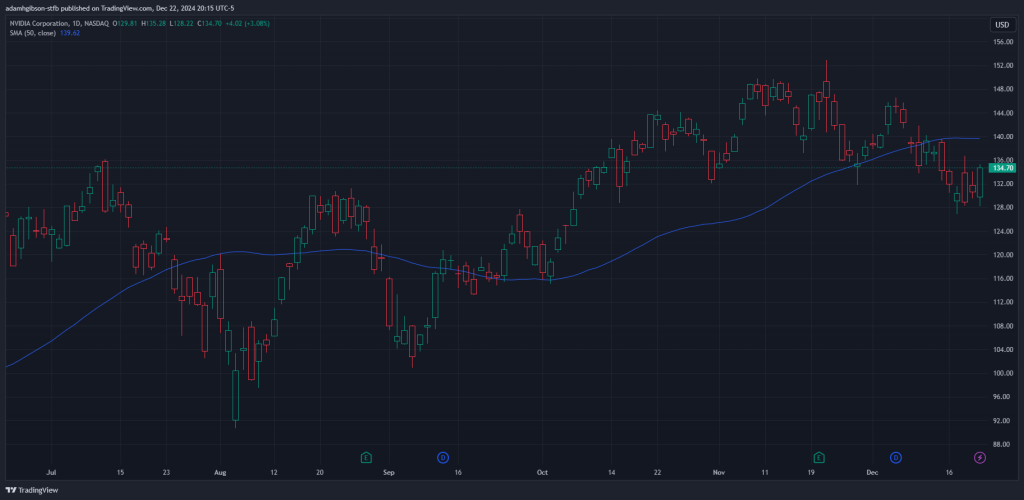 SMA 50
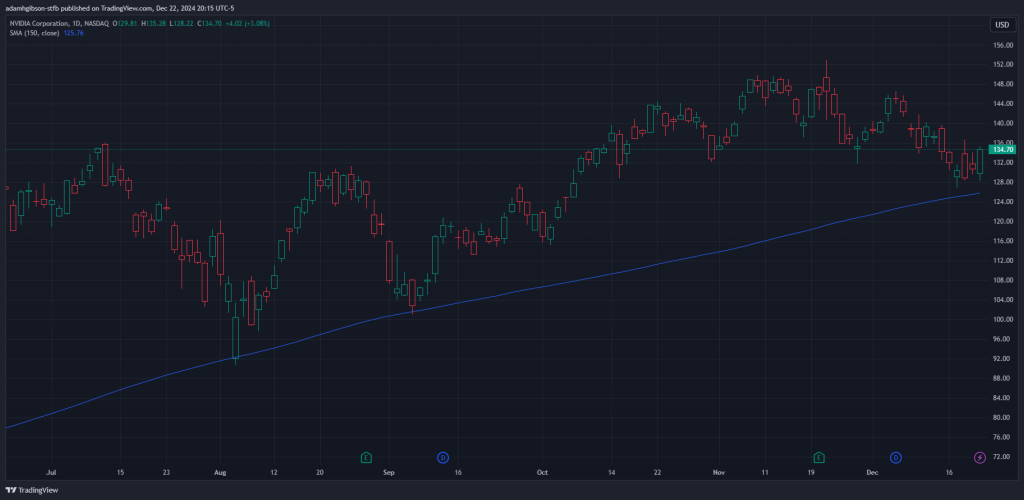 SMA 150
Calculation: These prices are added together and divided by the total number of periods to calculate the average.
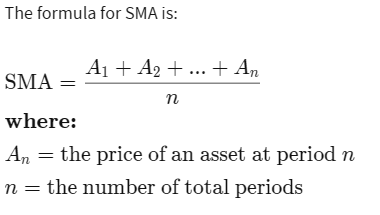 SMA formula thanks to investopedia.com
Chart Representation: The result is plotted on a chart, creating a moving average line that moves as new price data is added.
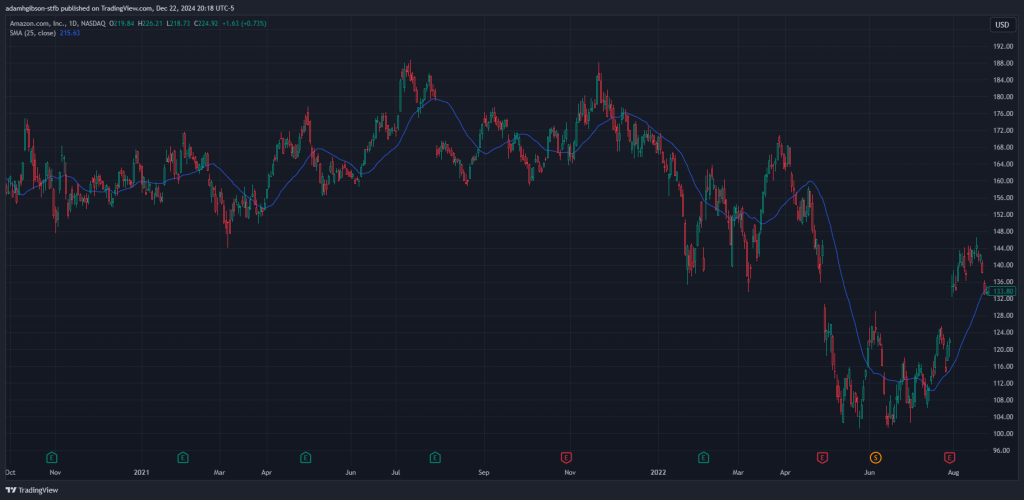 SMA Indicator on chart
For example, if you’re using a 150-period SMA, the line will show the average closing price over the last 150 trading days. As the stock’s price changes, the SMA adjusts, creating a smoother representation of the stock’s overall trend.
It’s important to note that shorter-period SMAs (e.g., 20-day) are more sensitive to price changes and are often used for short-term trading, while longer-period SMAs (e.g., 150-day) are better suited for identifying long-term trends.
Practical Applications of the SMA Indicator
The SMA is highly versatile and can be applied to various trading strategies. Here are some practical ways to use the SMA in stock trading:
Identifying Trends:
An upward-sloping SMA indicates a bullish trend, while a downward-sloping SMA signals a bearish trend. Traders often use crossovers—when a shorter SMA crosses above a longer SMA—as confirmation of trend changes.
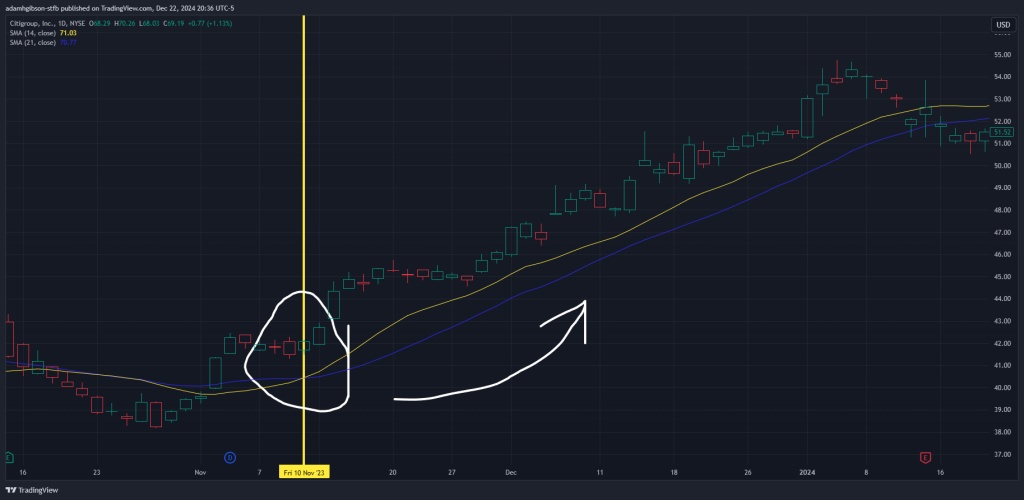 2 SMAs, one is set to 14, the other set at 21. The 14 SMA crossing above the 21 SMA indicates the start of a bullish trend.
Support and Resistance Levels:
Stocks often find support near a rising SMA or resistance near a declining SMA, making these levels ideal for planning trades.
Triggering Trend Trades with the 150-Period SMA and MACD:
The 150-period SMA is a favorite among trend traders for identifying major trends.
When the stock price crosses above the 150-period SMA, it signals a potential bullish trend, while a cross below it suggests a bearish trend.
Coupling this strategy with the MACD indicator—which measures momentum—adds an extra layer of confirmation. For example, a price cross above the 150-period SMA combined with a bullish MACD crossover (where the MACD line crosses above the signal line) provides a strong buy signal.
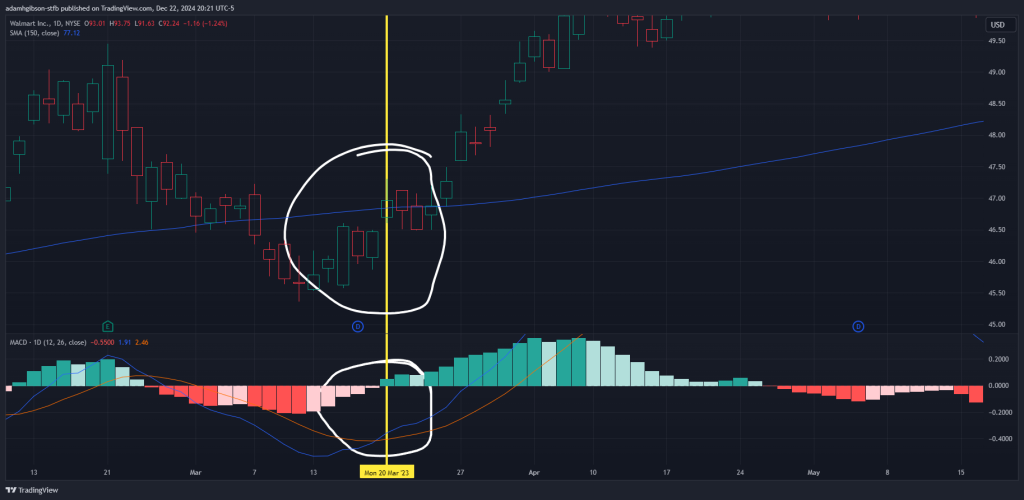 150 SMA and MACD Cross
Filtering Market Noise:
The SMA smooths out short-term price fluctuations, helping traders focus on the bigger picture. It’s able to do this, thanks to its inherent simplicity and ease of use. This filtering effect by the SMA can be further exacerbated by cranking up the period setting on the indicator to get less “reactive” signals out of it.
Tips for Using the SMA Effectively
- Customize Your Periods: Experiment with different SMA periods (e.g., 20, 50, 150) to find what works best for your trading style.
- Combine with Other Indicators: Enhance the reliability of SMA signals by pairing them with tools like the MACD or Relative Strength Index (RSI).
- Use in Trending Markets: The SMA is most effective in trending markets; avoid relying solely on it in choppy or sideways markets.
- Backtest Your Strategy: Always test your SMA-based strategies on historical data to ensure their effectiveness before trading live.
Conclusion: Why the SMA is a Must-Have Tool for Beginners
The Simple Moving Average is a straightforward yet powerful indicator that helps traders identify trends, confirm market momentum, and make informed trading decisions. Its ability to smooth out price data and provide clear signals makes it an essential tool for beginners looking to navigate the complexities of the stock market.
By incorporating advanced strategies, such as using the 150-period SMA with MACD confirmation, traders can increase the accuracy of their trades and gain confidence in their decisions.
Remember, while the SMA is a valuable tool, no indicator is foolproof. Always combine it with other indicators and risk management practices to create a well-rounded trading strategy. As you gain experience, the SMA will become a trusted ally in your journey toward trading success.