Introduction
The Least Squares Moving Average (LSMA) is a technical indicator designed to minimize noise and provide a smooth representation of price trends.
By employing statistical principles, the LSMA calculates the best-fit line for price data over a specific period, reducing the impact of erratic fluctuations and highlighting the underlying direction of the market.
Its unique approach sets it apart from other moving averages, making it a valuable tool for traders seeking accuracy and reliability in their technical analysis.
In trading, the ability to filter out market noise and focus on genuine trends is crucial for making informed decisions. The LSMA excels in this area by applying regression analysis to price data, offering insights that are not only precise but also predictive in nature.
By the end of this article, you will understand how the LSMA works, how it compares to other indicators, and how to use it effectively in your trading strategies.
What Is the LSMA?
The Least Squares Moving Average is a type of moving average that employs linear regression to calculate the best-fit line for price data over a defined period.
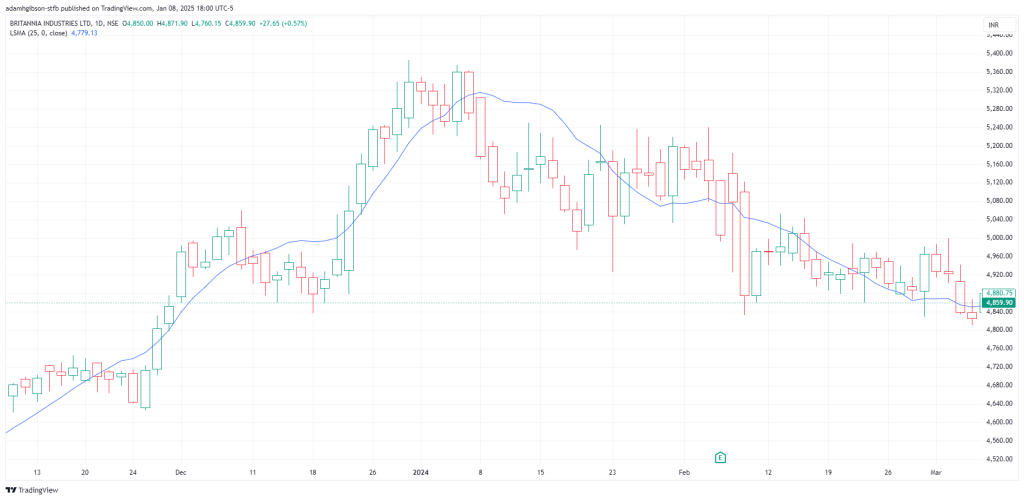 LSMA – Least Squares Moving Average
Unlike traditional moving averages, which merely smooth price data by averaging values, the LSMA determines the line that minimizes the sum of squared deviations between the line itself and the actual price points. This mathematical precision allows the LSMA to provide a clearer representation of the market’s true direction.
The LSMA’s origins can be traced back to statistical regression analysis, a technique widely used in various scientific disciplines to analyze relationships between variables. In the context of trading, the LSMA adapts this principle to financial markets, offering traders a sophisticated tool for identifying trends and potential reversals.
Its ability to highlight the prevailing direction of price movement, while filtering out minor fluctuations, makes it particularly appealing to traders looking for a balance between responsiveness and stability.
When compared to more common moving averages, such as the Simple Moving Average (SMA) or Exponential Moving Average (EMA), the LSMA stands out for its predictive qualities. The LSMA attempts to project where the price is likely to move next, giving traders an edge in dynamic market conditions.
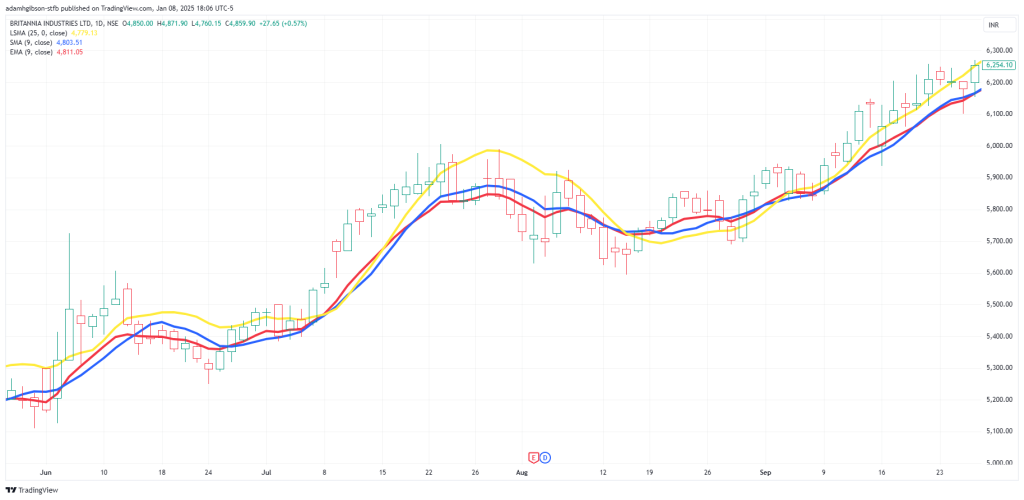 The YELLOW line represents the LSMA. The BLUE line represents the SMA. The RED line represents the EMA. As you can see by these 3 MAs side-by-side, the LSMA is a lot less reactive than the others. Instead of averaging price by itself, the LSMA is applying a different calculation using linear regression for its output.
How Does the LSMA Work?
The LSMA works by applying the method of least squares to calculate the slope and intercept of the best-fit line for price data over a specified number of periods.
This involves analyzing past price points to determine the line that minimizes the sum of squared differences between the line and the actual prices. The resulting line represents the overall direction of the market during the selected timeframe.
LSMA Calculation
The calculation of the LSMA is more complex than that of standard moving averages. It involves summing the products of time and price, as well as calculating the average values for both variables. These values are then used to derive the slope and intercept of the best-fit line.
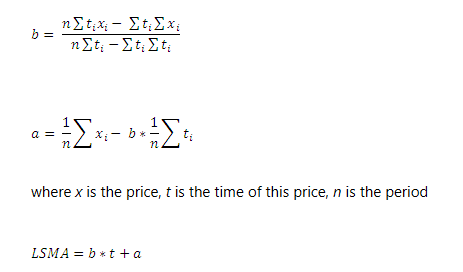 Calculation of the Least Squares Moving Average, thanks to rtmath.net. You can click this formula to visit their brief guide on the LSMA.
Despite its mathematical complexity, most trading platforms automate the calculation, allowing traders to focus on interpreting the results rather than performing the calculations manually.
One of the key features of the LSMA is its predictive nature. By projecting the best-fit line forward, the LSMA provides an estimate of where prices may move next. This forward-looking aspect, combined with its ability to smooth out noise, makes the LSMA an invaluable tool for traders who need accurate and actionable insights into market trends.
Using the LSMA in Trading
Incorporating the LSMA into a trading strategy begins with adding the indicator to your chart, a process that is supported by most modern trading platforms (like tradingview.com). The LSMA is typically plotted as a single line that overlays the price chart, providing a visual representation of the prevailing trend. By observing the interaction between the LSMA and the price, traders can identify potential buy and sell opportunities.
LSMA Bullish and Bearish Trends
- When the price crosses above the LSMA, it indicates a bullish trend, suggesting a potential entry point for long positions.
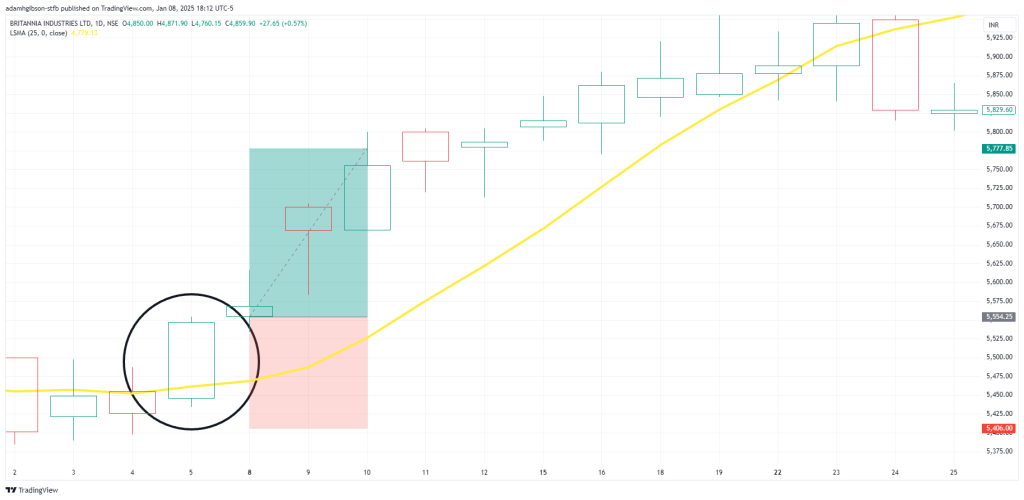 We can see that inside the black circle, price crossed up over the LSMA and we entered our position. In real practice we would want to utilize confluence factors to ensure optimal trading odds in our favor.
- Conversely, when the price moves below the LSMA, it signals a bearish trend, providing an opportunity to enter short positions or exit existing long trades.
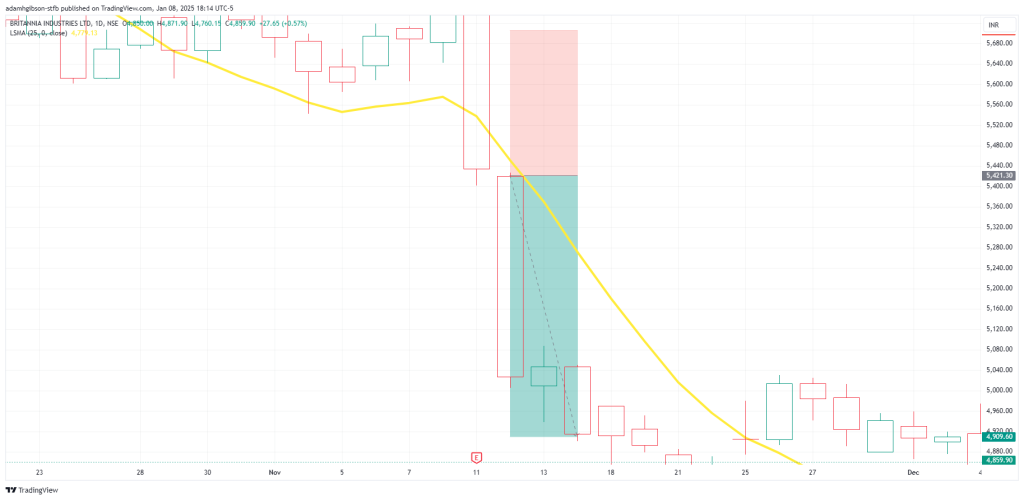 Same situation here as with the last one. Price drops below the LSMA and we take our position. But, just as stated before, you’ll still want to justify these decisions with confluence factors.
These signals are particularly reliable when confirmed by additional indicators, such as Relative Strength Index (RSI) or Moving Average Convergence Divergence (MACD).
LSMA on a Consolidating Market
The LSMA is also effective for identifying reversals and breakouts. During periods of consolidation, the LSMA often flattens out, reflecting the absence of a clear trend.
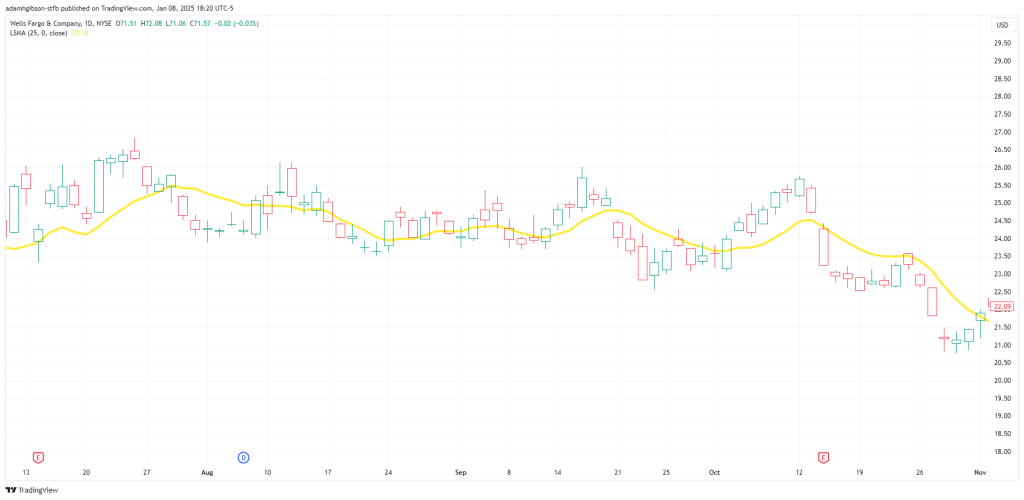 Here you can see the LSMA falling flat as price enters into a consolidation phase, where the market begins to move sideways with little to no momentum.
A sharp movement in the price that causes it to cross the LSMA can indicate the beginning of a new trend. To increase the reliability of these signals, traders may use volume analysis or other momentum indicators as confirmation.
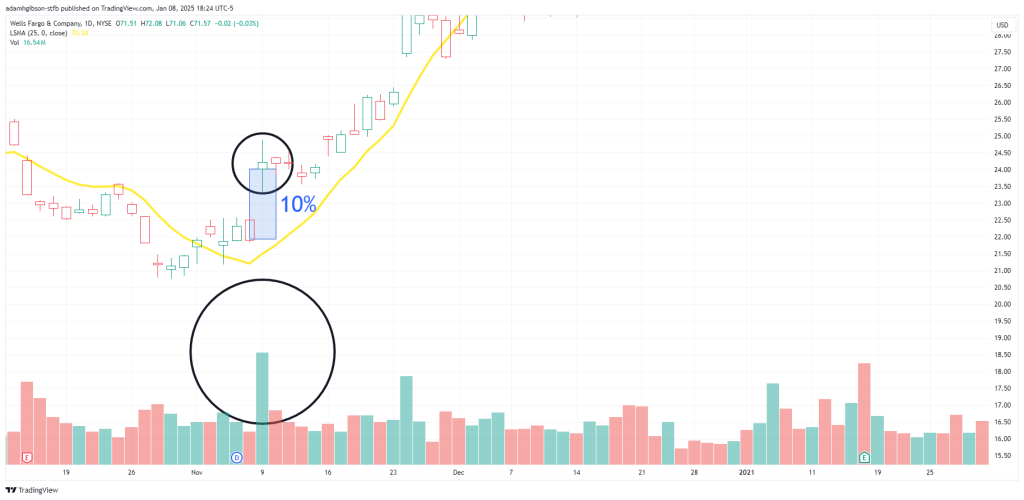 Here, we see price gap up after shortly crossing the LSMA noted by the top black circle. We pair this with analyzing the volume spike noted by the bottom circle. These 2 together give us a good start into starting to form a potential entry on this stock.
LSMA Trading Strategies
The LSMA can be employed in various trading strategies, depending on the trader’s goals and risk tolerance. For trend-following strategies, the LSMA serves as a reliable guide for identifying the direction of the market. Traders can use the slope of the LSMA to determine whether the trend is bullish or bearish, adjusting their positions accordingly.
Bullish Scenario
- In a bullish scenario, a trader might enter a long position when the price rebounds from the LSMA after a minor pullback. A stop-loss order can be placed just below the LSMA to protect against unexpected reversals.
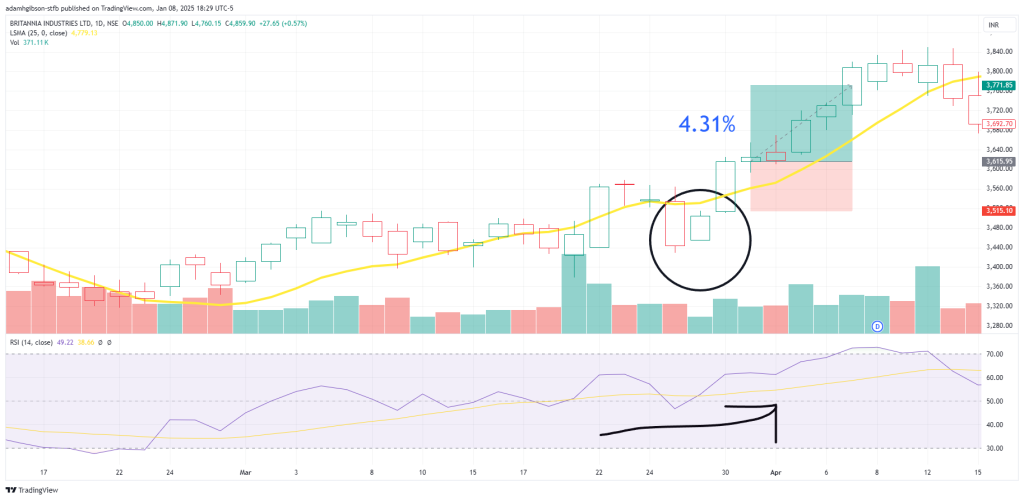 We pair the LSMA with the RSI for additional confirmation on our trade. Price rebounds from a brief drop below the LSMA with the RSI moving upwards, but not overbought yet. This would end up yielding us a 4.31% win in just 5 days.
Bearish Scenario
- Conversely, in a bearish market, a trader might enter a short position when the price fails to break above the LSMA during a temporary rally, with a stop-loss placed just above the line.
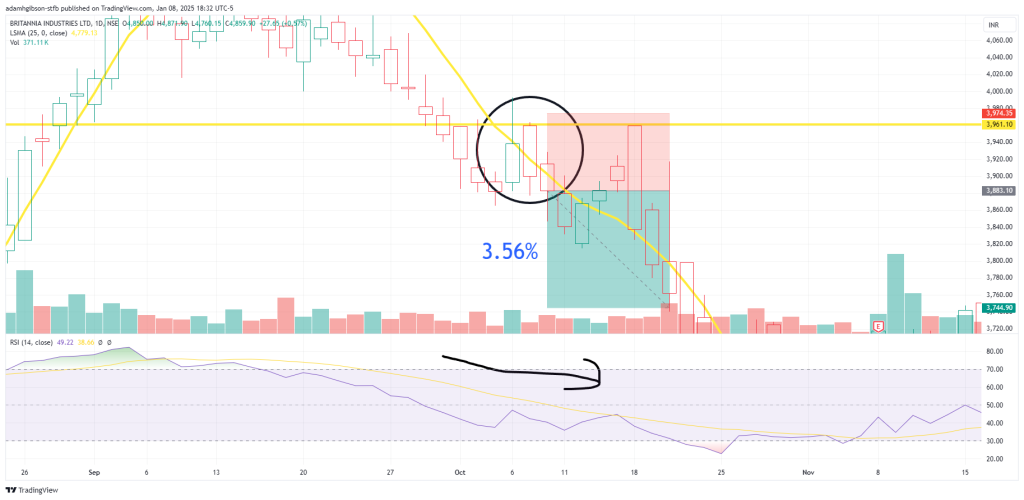 Same deal here, but bearish trend instead. Price has a brief pullback above the LSMA from it’s downtrend, shown by the black circle. The RSI is trending down, but not oversold yet. Our short position makes us 3.56% on our trade.
For range-bound markets, the LSMA can act as a dynamic support or resistance level. Traders can buy when the price approaches the LSMA from below and sell when it nears the line from above.
These trades are typically shorter-term and require careful monitoring to account for the potential of a breakout.
Setting take-profit targets often involves analyzing nearby support and resistance levels or using tools like Fibonacci retracements. The LSMA itself can provide additional guidance, as significant deviations from the line often precede reversals or corrections.
Benefits and Limitations
The LSMA offers numerous advantages, making it a valuable addition to any trader’s toolkit. Its reliance on regression analysis ensures a high degree of accuracy, filtering out noise and highlighting genuine trends. This makes it particularly effective in volatile markets, where other moving averages may struggle to provide reliable signals.
Additionally, the LSMA’s predictive qualities set it apart from other indicators. By projecting the best-fit line forward, it offers traders a glimpse into potential future price movements, allowing for more proactive decision-making. Its versatility across various timeframes and trading styles further enhances its appeal.
However, the LSMA is not without limitations. Furthermore, the LSMA’s complexity may make it less accessible to novice traders who are unfamiliar with regression analysis.
LSMA Confluence With Other Indicators
To address these limitations, traders should use the LSMA in conjunction with other indicators and adopt a disciplined approach to risk management. Understanding the contexts in which the LSMA excels allows traders to leverage its strengths while mitigating its weaknesses.
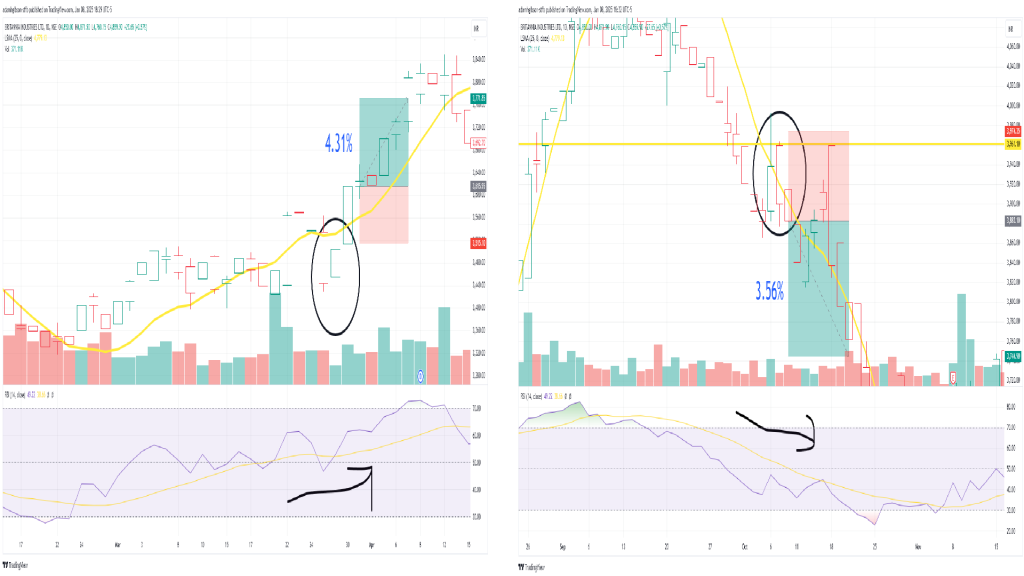 Just as shown in the examples before, we utilize other indicators like the RSI and volume to make higher probability decisions when taking our trades.
Critical Points
The Least Squares Moving Average is a sophisticated yet practical tool for technical analysis, offering a precise and predictive approach to identifying market trends. By minimizing noise and focusing on genuine price movements, the LSMA provides traders with actionable insights that can enhance their strategies and improve decision-making.
While the LSMA has its limitations, its benefits far outweigh the drawbacks when used correctly. Combining it with complementary indicators and maintaining a robust risk management plan ensures that traders can maximize its potential. Whether you are a beginner or an experienced trader, the LSMA offers valuable insights that can help you navigate the complexities of financial markets with confidence.