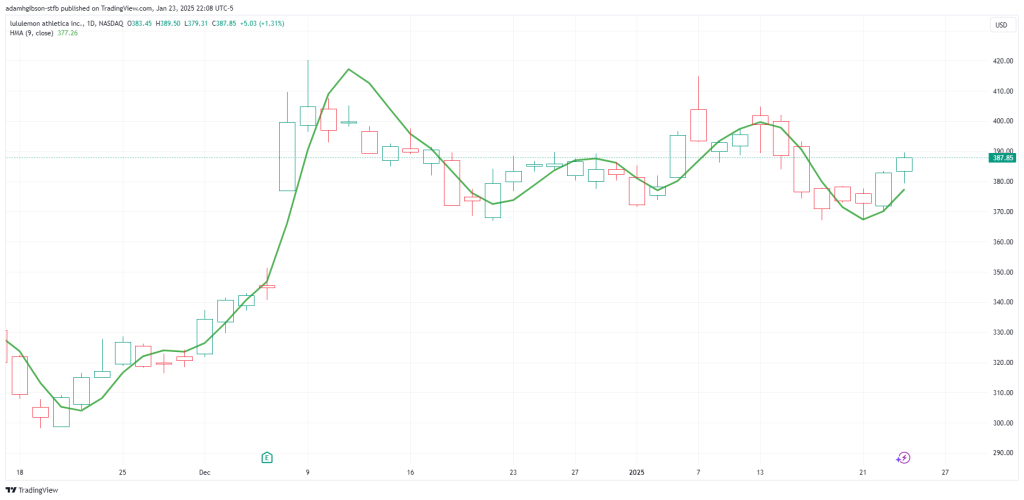
The Hull Moving Average (HMA) is a technical indicator that has gained popularity among traders for its ability to smooth price data while reducing lag. Designed to provide a clearer and more responsive representation of market trends, the HMA stands out as an innovative solution in the realm of moving averages.
Unlike traditional moving averages, which often struggle to balance smoothness and responsiveness, the HMA combines both features, making it a powerful tool for technical analysts.
Traders often seek indicators that not only highlight the prevailing market trend but also respond quickly to price changes. The HMA achieves this by employing a unique calculation method that incorporates weighted moving averages and a square root function to adjust its responsiveness.
This guide delves into the origins of the HMA, explains how it works, and explores practical ways to use it effectively in trading strategies.
History and Origins
The Hull Moving Average was developed by Alan Hull, a financial analyst and trader who sought to overcome the common trade-off between smoothness and lag in traditional moving averages.
 Alan Hull – The creator of the Hull Moving Average
His work on the HMA was driven by the need for a tool that could provide accurate trend detection without sacrificing responsiveness.
 HMA – Hull Moving Average
A lesser-known fact about the HMA is that it was originally created to address the challenges faced by traders who required precise signals in volatile markets. Alan Hull’s approach was innovative, as it combined the principles of weighted moving averages with a unique mathematical adjustment to achieve an ideal balance.
In today’s trading environment, the HMA is widely recognized for its versatility and effectiveness. It has become a staple for traders who value precision and adaptability, especially in fast-moving markets. Whether used for trend analysis, entry and exit signals, or identifying reversals, the HMA has proven to be an invaluable tool for both retail and institutional traders.
What Is the HMA?
The Hull Moving Average is a type of moving average that aims to eliminate lag while maintaining a high degree of smoothness in its representation of price trends. Traditional moving averages, such as the Simple Moving Average (SMA) or the Exponential Moving Average (EMA), often lag behind price action due to their reliance on historical data.
The HMA overcomes this limitation by applying weighted adjustments that make it more responsive to recent price changes.
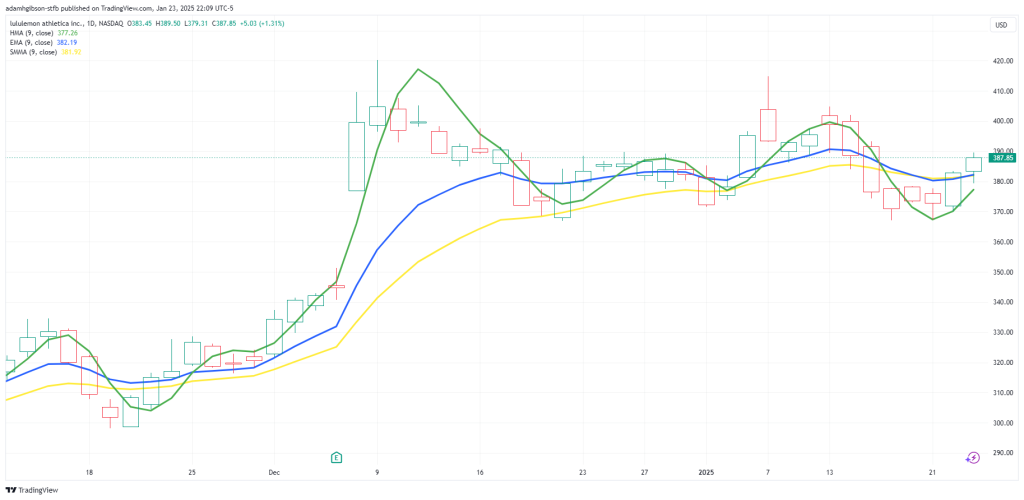 A comparison between the EMA (BLUE line), SMA (YELLOW line) and HMA (GREEN line) indicators. You can easily see with these indicators side by side the reactivity to price change varies depending on which indicator you’re using. The SMA has more smoothed out signals, the EMA has faster signaling than the SMA, while the HMA has the most reactive signals of all 3.
One of the defining characteristics of the HMA is its ability to provide real-time insights into market trends. While other moving averages may reflect trends that are already well-established, the HMA’s responsiveness allows traders to detect changes as they occur. This makes it particularly useful for short-term trading strategies, where timing is critical.
 You can see that in a well trending market with good momentum, the HMA can quickly detect price trend changes early, allowing you to identify signals early and take more from the market for yourself.
When compared to similar tools, such as the Weighted Moving Average (WMA), the HMA distinguishes itself through its use of a square root function to optimize its smoothing and responsiveness.
This unique approach ensures that the HMA remains both accurate and adaptive, making it an ideal choice for traders who require a reliable indicator in various market conditions.
How the HMA Works
The HMA is calculated using a combination of weighted moving averages and a square root function. The first step involves calculating a WMA for a specified period. This WMA is then adjusted by subtracting a second WMA, calculated for half the original period.
The resulting value is smoothed further by applying another WMA over a period equal to the square root of the original timeframe.
Formula
 Depiction of the formula thanks to enlightenedstocktrading.com
The formula for the HMA can be summarized as follows:
- Calculate the WMA for the chosen period.
- Subtract the WMA of half the chosen period.
- Apply a final WMA using the square root of the original period.
This layered calculation process ensures that the HMA responds quickly to price changes while minimizing noise. The square root function plays a crucial role in achieving this balance, as it reduces the weight of longer periods without compromising the overall trend analysis.
Key components of the HMA include its adaptability and accuracy. The indicator can be customized for different timeframes and trading styles, making it suitable for a wide range of applications.
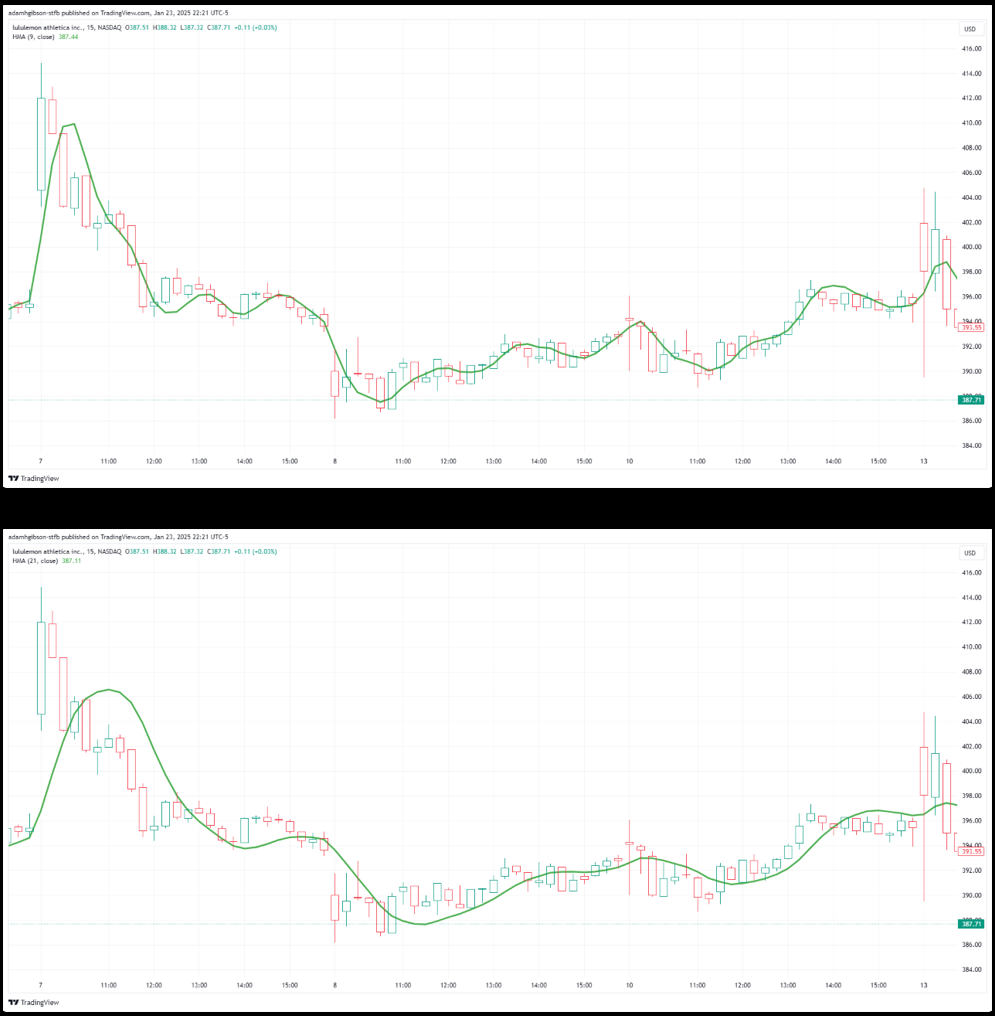 In these 2 chart examples, the top represents an HMA with a faster reactive setting of a period set to 9, which is a standard setting for the HMA. On the bottom, the period setting is set to 21, which is a more conservative setting for the HMA, which allow us to make less reactive decisions, helping us to save on trading so much, reducing our overall cost of slippage and spread when trading the markets.
Whether used on a daily chart to identify long-term trends or on an intraday chart for short-term trades, the HMA consistently delivers reliable insights.
Using the HMA in Trading
The HMA’s ability to provide smooth and responsive trend lines makes it a versatile tool for traders. One of the most common applications is identifying the direction of the market.
Trade Signals With HMA
Bullish Signal
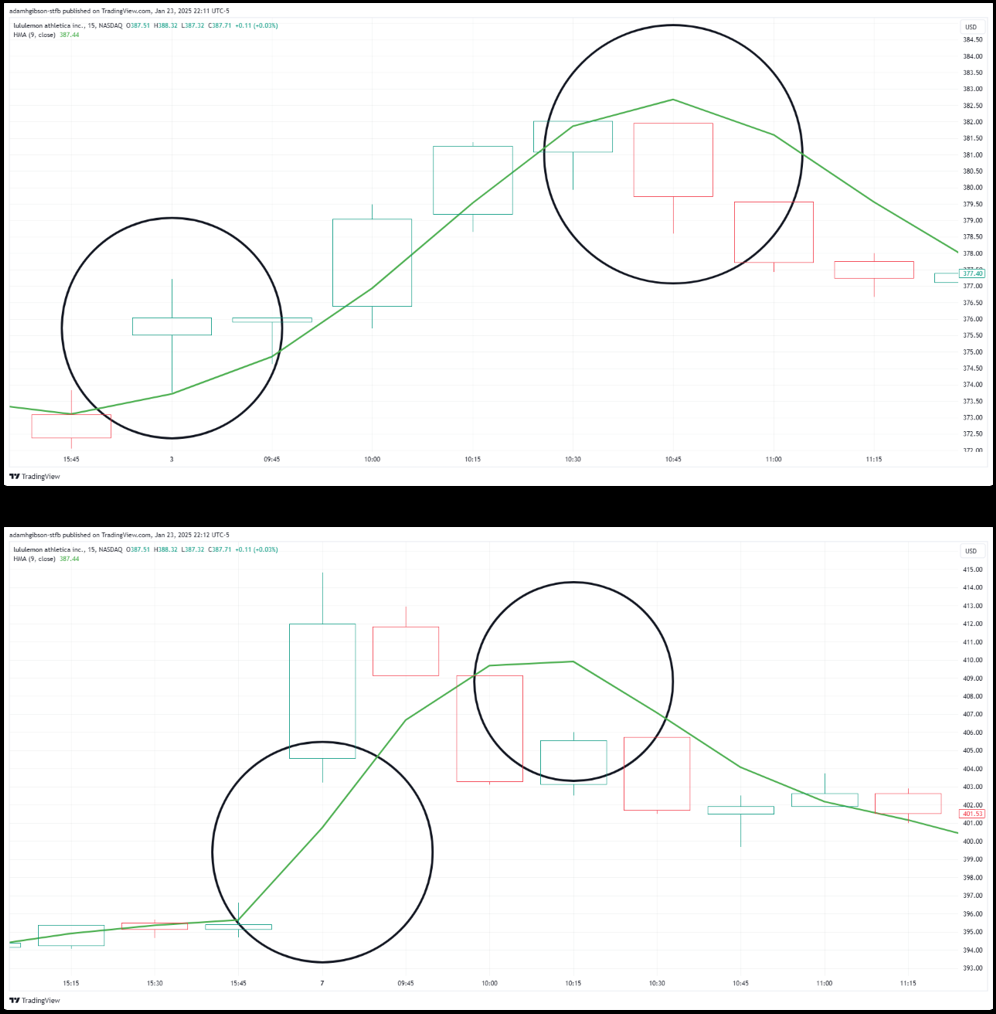
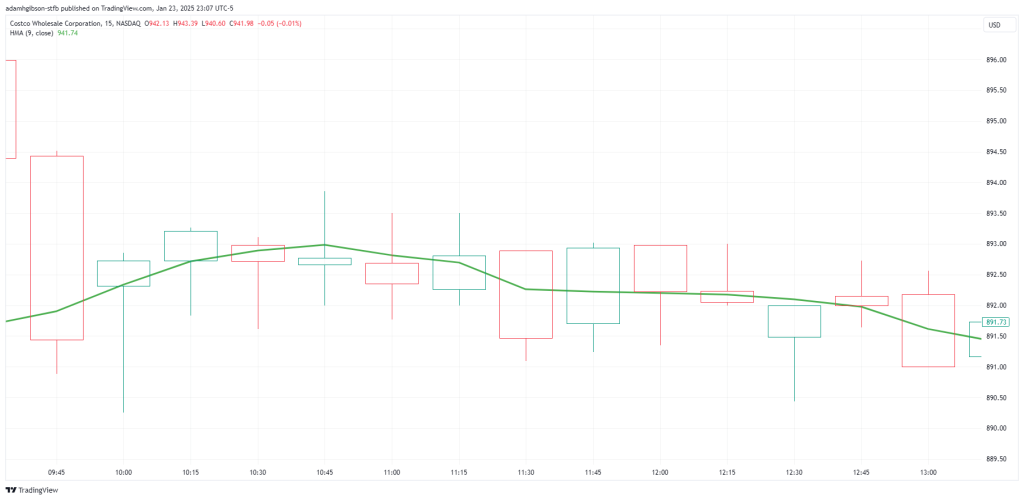
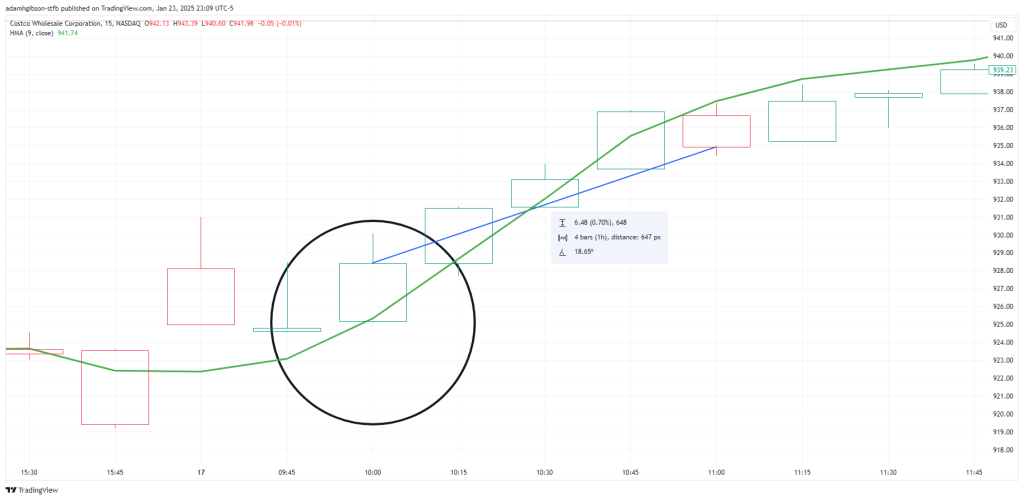
When the HMA slopes upward, it indicates a bullish trend.
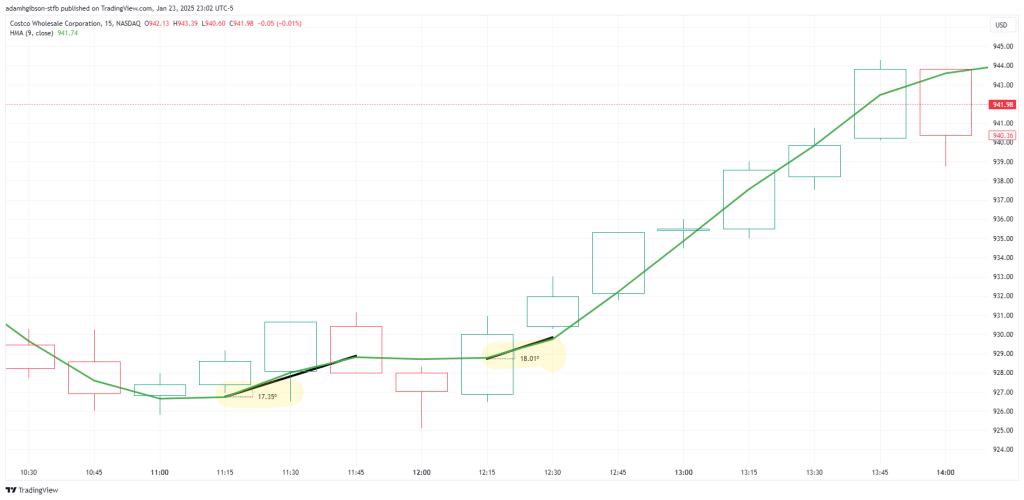 Looking at the chart, we are able to measure the angles of the HMA indicator and adequately gauge the slope of the HMA, so that we can know when the trend is beginning to change direction and take shape.
Bearish Signal
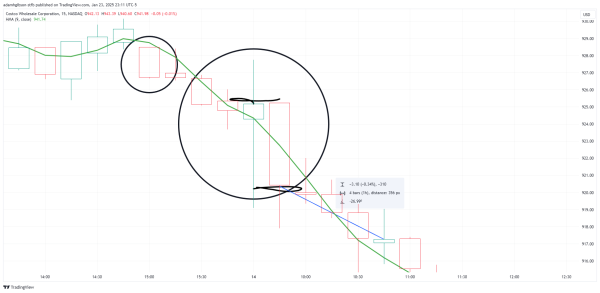
while the HMA sloping downwards signals a bearish trend.
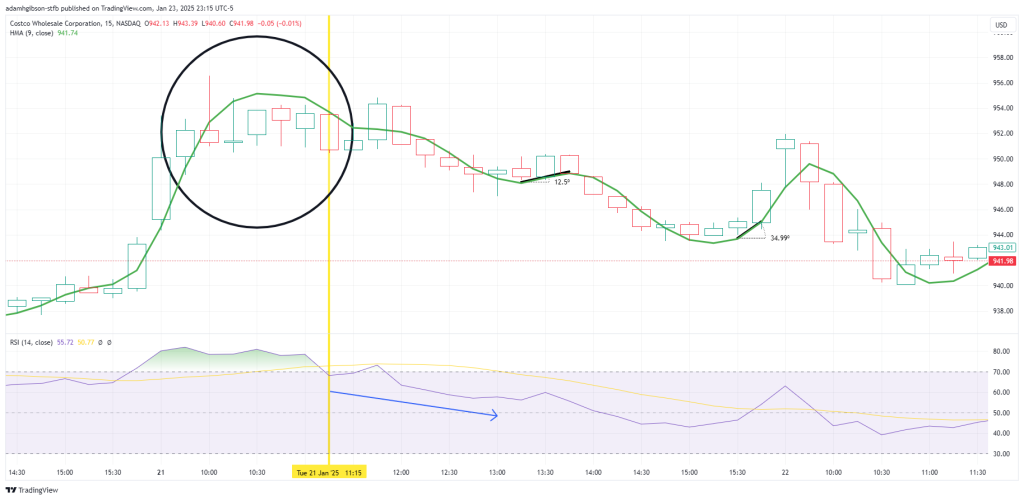
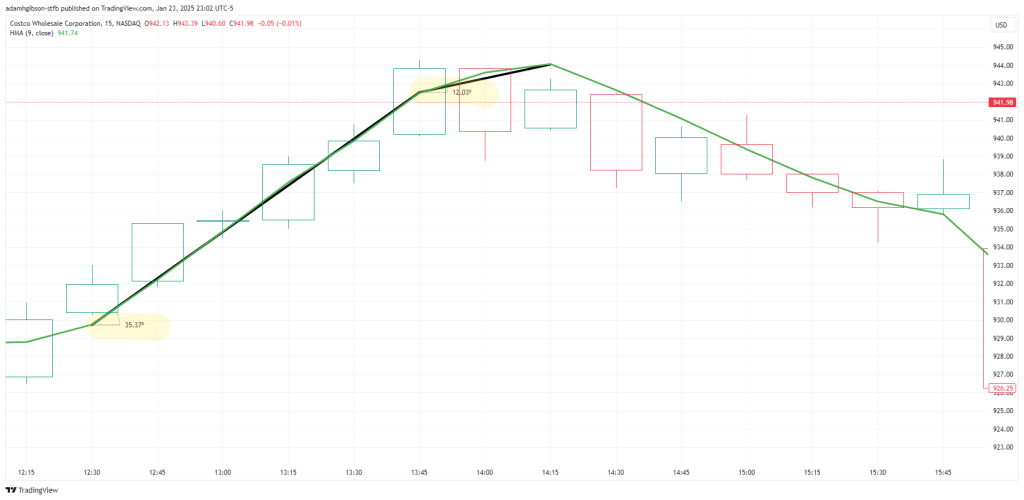 Here, we can see that the angle measure of the HMA at the beginning slope is 35 degrees, then the slope of the HMA angle goes down to 12 degrees, letting us know that the trend is most likely about to turn around and reverse.
This clarity makes it easier for traders to align their strategies with the prevailing market sentiment.
In real-world trading scenarios, the HMA is often used to generate BUY and SELL signals.
Price Crosses
Bullish Cross
For instance, when the price crosses above the HMA, it suggests a potential buying opportunity.
 Price crosses above the HMA, giving the signal that a potential uptrend is underway. We know to get out of the trade when price crosses back under the HMA.
Bearish Cross
Conversely, when the price falls below the HMA, it indicates a possible selling opportunity.
 Same idea here, except the opposite. Price closes & crosses under the HMA, letting us know that there may be a price reversal from the upside to the downside. We know to get out when price closes back above the HMA.
These signals are particularly effective when confirmed by other indicators, such as Relative Strength Index (RSI) or Moving Average Convergence Divergence (MACD).
Reversals
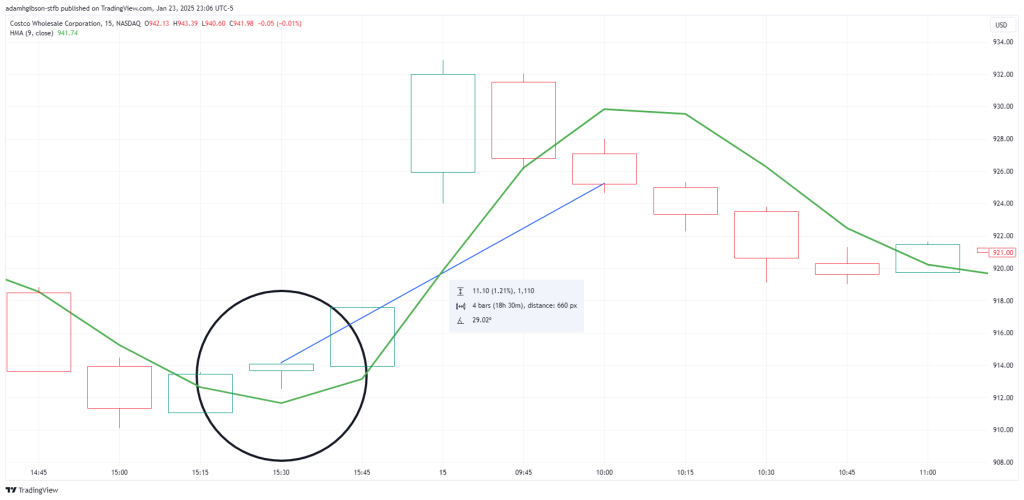
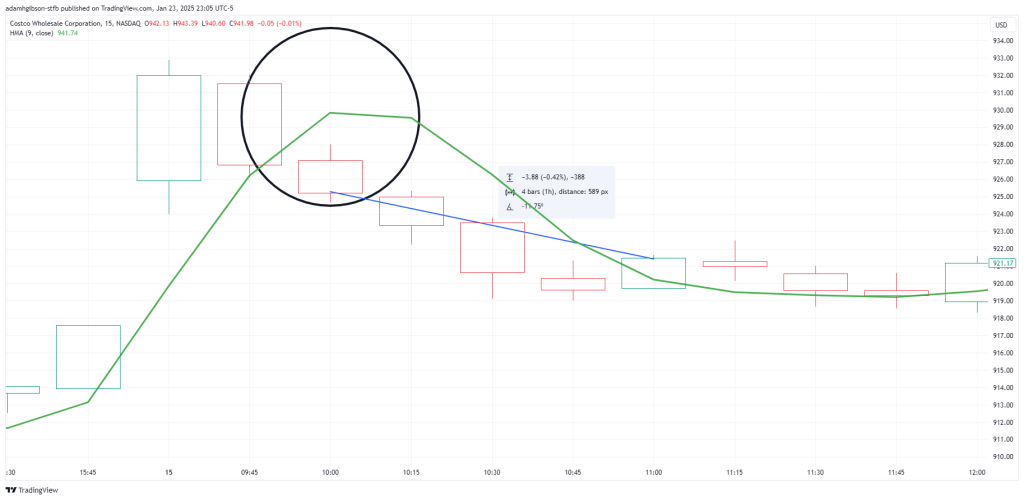
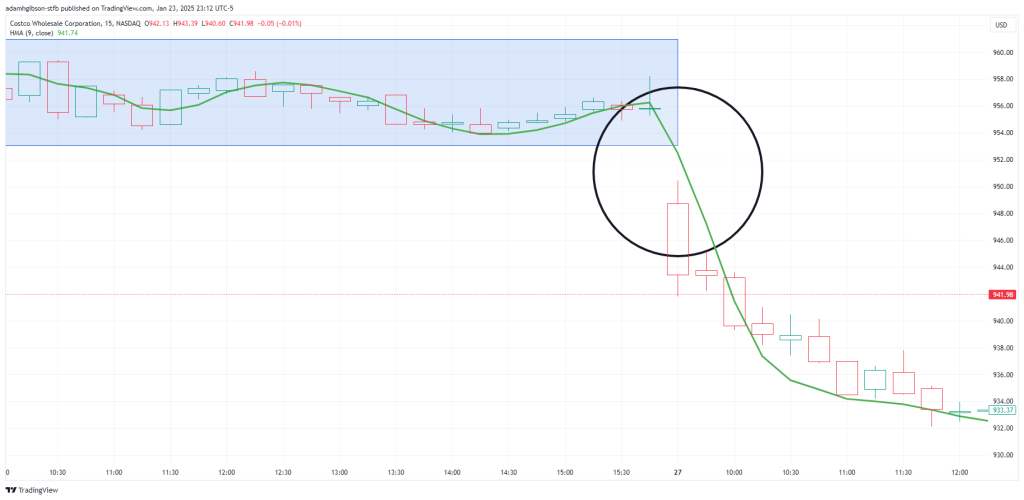
Another practical use of the HMA is in detecting trend reversals. During periods of consolidation, the HMA tends to flatten out, reflecting the absence of a clear trend. A sudden change in the slope of the HMA can indicate the beginning of a new trend, providing traders with valuable insights into potential market shifts.
 Looking at this chart, when there is no momentum in the market, and price is flat, the HMA also goes flat, along with momentum. The HMA really shines when momentum is high in the market. When price is not trending, the HMA has no advantage. But, fortunately, the HMA can signal to us when momentum is picking back up, so that we can know when to get back into the market.
To enhance its effectiveness, traders often combine the HMA with additional tools, such as Support and Resistance levels or Candlestick Patterns.
This integrated approach allows for more accurate analysis and reduces the risk of acting on false signals.
HMA Trading Strategies
The HMA can be integrated into a variety of trading strategies to suit different objectives. For trend-following strategies, traders rely on the slope of the HMA to confirm the direction of the market.
By entering long positions during upward trends and short positions during downward trends, traders can capitalize on sustained price movements.
Trends
Bullish Trend With HMA
In a bullish trend, traders might use the HMA as a dynamic support level, entering long positions when the price approaches or bounces off the line.
 This isn’t the way that I would typically use the HMA, because there are much better use cases for the HMA where it will better serve you, but this can still work depending on your strategy. Basically, the idea is to wait for price to bounce off of the HMA after crossing up, to allow a confirmation opportunity to get into the trade.
Stop-loss orders can be placed just below the HMA to protect against unexpected reversals.
Bearish Trend With HMA
Similarly, in a bearish trend, the HMA can act as a resistance level, providing opportunities for short-selling or exiting long positions.
Range Markets With HMA
For range-bound markets, the HMA can help traders identify breakout points. When the price moves decisively above or below the HMA, it often signals the start of a new trend.
 Price having completely broken out of the range in tandem with the HMA crossing above price can give us good indication that there may be opportunities to trade again, as the range has been broken.
To confirm these breakouts, traders may use volume analysis to gauge the authenticity of the momentum or momentum indicators.
Risk management is an integral part of any trading strategy involving the HMA. By setting appropriate stop-loss and take-profit levels, traders can minimize potential losses and lock in gains.
Benefits and Limitations
The Hull Moving Average offers several advantages that make it a preferred choice for many traders. Its ability to smooth price data while maintaining responsiveness provides a clear view of market trends, reducing the noise that can complicate decision-making.
Additionally, the HMA’s adaptability across different timeframes and trading styles enhances its utility in various market conditions.
HMA With Confluence
To mitigate unnecessary challenges, traders should use the HMA alongside other indicators and maintain a disciplined approach to risk management.
 Here, the RSI helps us as a confluence factor with the HMA. We see price break below the HMA. At the same time, we see the RSI in an overbought zone. Shortly after, price begins to decline, staying under the HMA and a steady declination of the RSI, giving us a good signal that there might be a good short trade here.
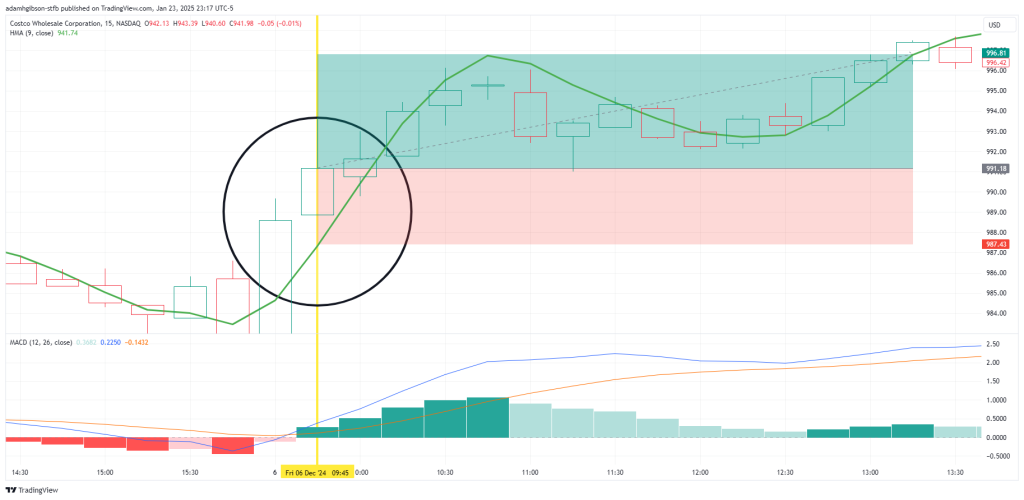 Here, the MACD has a histogram flip to the bullish side, along with a MACD line and signal line cross, as well as price moving above the HMA. These factors when added together show us that there is good odds for us to take a long position on this trade.
Understanding its strengths and weaknesses allows traders to leverage the HMA effectively and avoid common pitfalls.
Critical Points
The Hull Moving Average is a powerful tool for technical analysis, offering a unique combination of smoothness and responsiveness. By applying a sophisticated calculation method, the HMA provides accurate insights into market trends, helping traders make informed decisions. Its versatility and reliability make it a valuable addition to any trading strategy.
While the HMA has limitations, its benefits far outweigh the drawbacks when used correctly. By integrating the HMA with complementary indicators and adopting a systematic approach, traders can maximize its potential and improve their overall performance.
Conclusion
The Hull Moving Average is an innovative and effective indicator that addresses many of the challenges associated with traditional moving averages. Its ability to provide smooth, responsive trend lines makes it an indispensable tool for traders seeking accuracy and reliability.
By understanding how the HMA works and incorporating it into a well-rounded trading strategy, traders can gain a competitive edge in the market.