Introduction – What are the Bollinger Bands and who is John Bollinger?
Bollinger Bands are one of the most versatile and widely used tools in technical analysis. They help traders assess market volatility and identify potential trading opportunities by creating a dynamic range around price movements.
Introduced in the 1980s, Bollinger Bands consist of three components: a simple moving average (SMA), an upper band, and a lower band. These bands expand and contract based on market volatility, giving traders a visual framework to evaluate price action, determine overbought or oversold conditions, and anticipate breakouts or reversals.
What makes Bollinger Bands invaluable is their adaptability. Unlike fixed indicators, they adjust to market conditions, making them a go-to tool for analyzing price behavior in various scenarios. Whether you’re a seasoned trader or just starting, Bollinger Bands provide the insights needed to make more informed decisions.
Who Is John Bollinger?
 John Bollinger. Creator of the Bollinger Bands technical trading indicator.
John Bollinger, a renowned financial analyst and technical trader, developed Bollinger Bands in the early 1980s. He sought to create an indicator that could adapt to changing market conditions and better measure volatility.
Bollinger’s extensive knowledge of statistics and technical analysis culminated in this tool, which has become a staple in the trading world.
Bollinger first introduced his bands to the broader financial community through his book Bollinger on Bollinger Bands, where he explained their construction and use. The simplicity and reliability of Bollinger Bands quickly gained them popularity, cementing Bollinger’s place as one of the most influential figures in technical analysis.
How The Bollinger Bands Are Put Together
Bollinger Bands are made up of three lines:
- A Centerline, typically a 20-period simple moving average (SMA), which smooths out price fluctuations to reveal the overall trend.
- An Upper Band, plotted two standard deviations above the SMA.
- A Lower Band, plotted two standard deviations below the SMA.
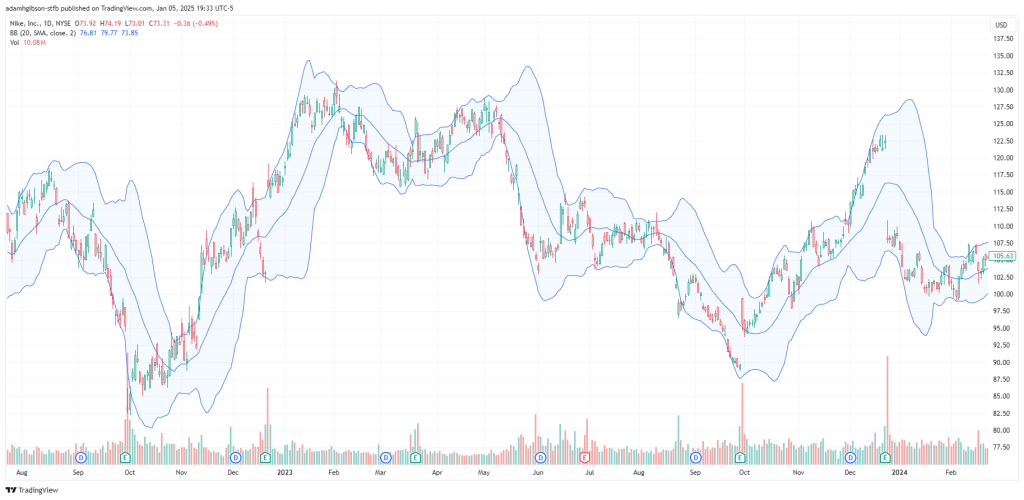 Upper band is the blue line on top. Lower band is the blue line at the bottom. Centerline is the blue line running through the middle of the upper and lower bands.
The calculation begins by computing the Simple Moving Average (SMA) over a chosen number of periods. Then, the standard deviation of the prices for the same period is calculated to determine the distance between the SMA and the upper and lower bands.
This construction ensures that the bands expand and contract based on price volatility.
- During volatile periods, the bands widen, reflecting significant price swings.
- In contrast, during periods of low volatility, the bands contract, signaling a consolidating market.
Traders can customize Bollinger Bands by adjusting the SMA period or the number of standard deviations. For instance:
- a shorter period, such as 10 periods, makes the bands more sensitive to price changes.
- while a longer period, like 50 periods, smooths out short-term fluctuations.
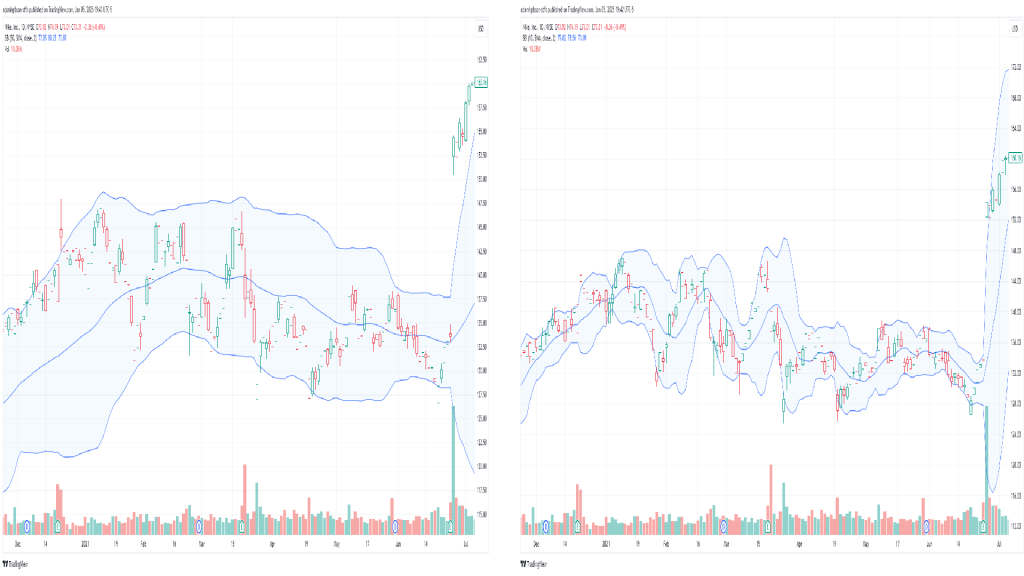 BB slow setting, centerline set to 50 on the left. BB fast setting, centerline set to 10 on the right.
Trading With The Bollinger Bands
Bollinger Bands offer a range of applications for traders. One of their primary uses is trend analysis.
When prices move consistently along the upper band, it signals strong bullish momentum, whereas prices moving near the lower band indicate bearish momentum. Traders can use this information to assess the strength and direction of a trend.
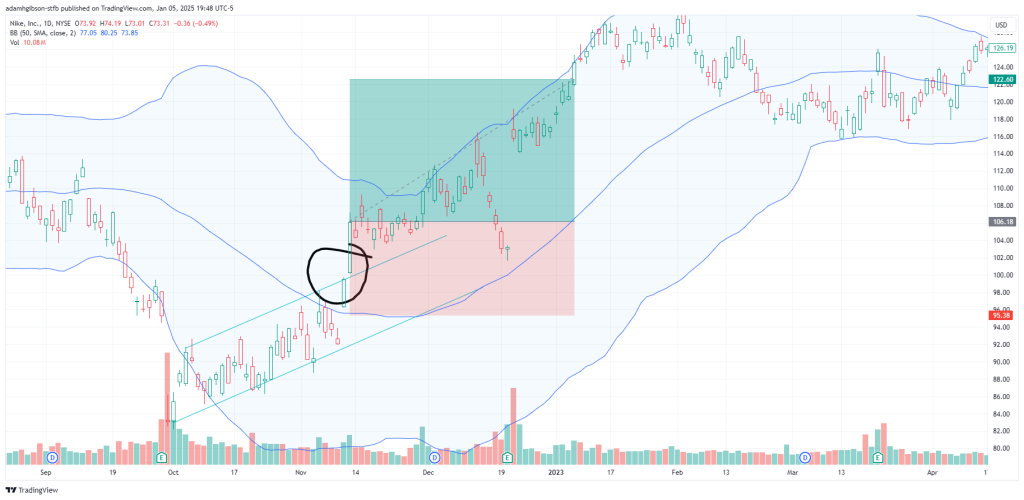 As shown by the chart, we had an ascending wedge formation, followed by a price break at the top line. To add to this, we also saw a recent price cross of the BB centerline with wide deviation, indicating a good amount of volatility for price to have the opportunity to move, and for us to profit. The Green and RED areas on the chart show a long position that we could’ve entered into with a 1.5:1 Risk/ Reward ratio, ending in us winning the trade.
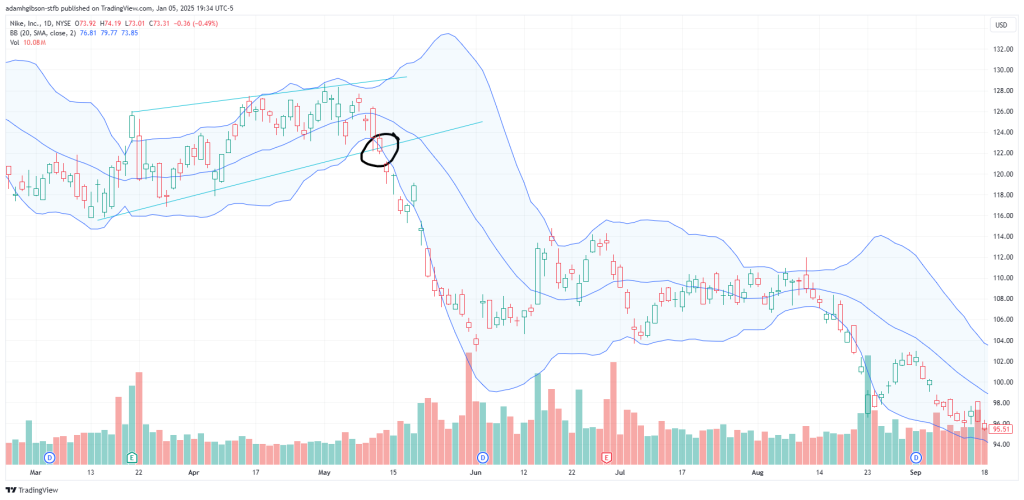 The chart shows where price fluctuations were converging, until finally breaking the bottom line, moving outside the lower band on the BB, recently crossing under the BB centerline and giving us the opportunity to enter into a short position. In this case, leading to a win.
The bands also help identify overbought and oversold conditions. When prices touch or exceed the upper band, it suggests the asset may be overbought, potentially leading to a price pullback.
Conversely, when prices approach the lower band, it indicates oversold conditions and a possible rebound. While these signals provide valuable guidance, they should always be confirmed with additional indicators or market context.
Breakouts are another scenario where Bollinger Bands prove useful. During periods of low volatility, the bands tighten, signaling potential breakout conditions.
A price movement outside the bands often indicates the start of a new trend. To validate these breakouts, traders often look at other indicators, such as volume or the Relative Strength Index (RSI).
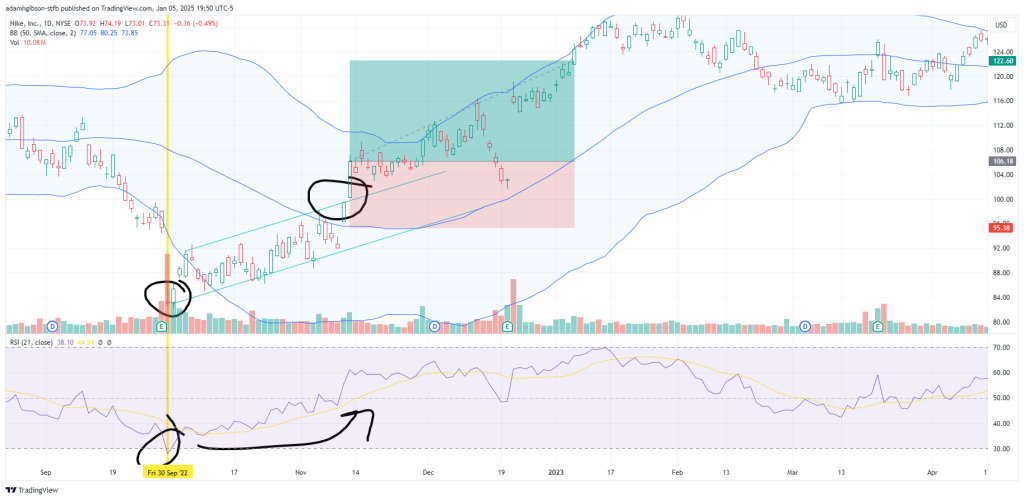 Here we see where price bottomed out as the RSI fell into the Oversold Zone, bounced back out and started trending up. Shortly after, price gets locked into an ascending corridor. Price crosses above the BB centerline and breaks the top line of the corridor. Giving us triple confirmation to enter into a long position, ending in a win for us.
Signals at the Upper and Lower Bands
The upper and lower bands of Bollinger Bands act as dynamic resistance and support levels, respectively. When prices approach or cross the upper band, it often signals that the asset is overbought.
However, in strong uptrends, prices can remain near the upper band for extended periods, reflecting persistent bullish momentum rather than an immediate reversal.
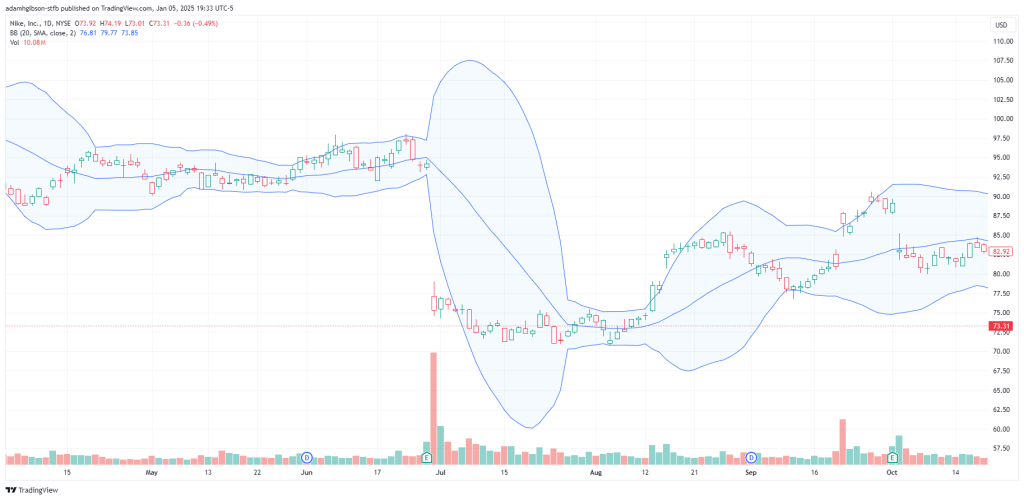 Extraordinary large upper and lower bands show massive movement happening in the market.
Similarly, when prices touch or fall below the lower band, it may indicate that the asset is oversold. During strong downtrends, prices may hover near the lower band as selling pressure dominates.
These signals provide traders with important context, but they work best when used in conjunction with other indicators or technical patterns to confirm the overall market sentiment.
Widening and Tightening Bands
One of the defining features of Bollinger Bands is their ability to reflect market volatility through the distance between the bands. When the bands widen, it signifies increased volatility, often due to major price movements or external factors such as news or economic data.
- Traders interpret this widening as an opportunity to capitalize on heightened activity, as it often accompanies significant trend developments.
- Conversely, tightening bands indicate reduced volatility and a consolidating market. This condition frequently precedes a breakout, as the market builds momentum for a decisive move.
Traders monitor these tightening bands closely, looking for additional confirmation from other indicators before entering trades. Understanding this relationship between volatility and the behavior of the bands is crucial for effective trading.
Reliability Of The Bollinger Bands
The reliability of Bollinger Bands depends on how they are used and the prevailing market conditions. In trending markets, Bollinger Bands excel at identifying momentum and potential reversals, making them a highly effective tool. However, their reliability decreases in sideways or choppy markets, where false signals are more common.
To enhance the accuracy of Bollinger Bands, traders often combine them with complementary indicators. For example, using Bollinger Bands alongside RSI can help confirm overbought or oversold conditions.
Pairing them with Moving Average Convergence Divergence (MACD) provides additional insights into momentum and trend changes. By incorporating Bollinger Bands into a broader analytical framework, traders can make more informed decisions and reduce the likelihood of acting on misleading signals.
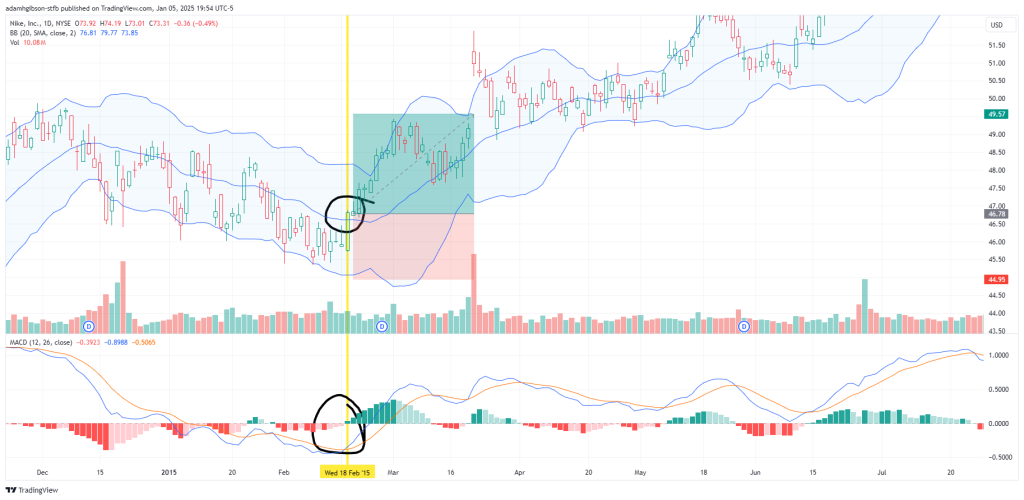 Here, we pair the MACD and BB up together to give us additional trade confirmation before taking our trades. The yellow vertical line shows where the MACD cross and BB centerline cross occurred back-to-back. Thus, giving us very good confirmation to enter into a long position. 1.5:1 risk/ reward ratio. Set the stop loss a right below the lower band. Ending in another win for us.
Limitations To Consider When Trading With Bollinger Bands
Despite their utility, Bollinger Bands have limitations. One of their primary drawbacks is their reliance on historical price data, which makes them a lagging indicator.
This lag can result in delayed signals, particularly during periods of rapid market change.
Another limitation is the potential for false signals, especially in low-volatility environments. Prices may touch or move outside the bands without leading to a significant trend change, causing traders to make premature or erroneous decisions.
Additionally, Bollinger Bands do not account for fundamental factors, such as earnings reports or macroeconomic events, which can significantly influence price movements.
The Bollinger Bands are mainly a technical trading indicator!
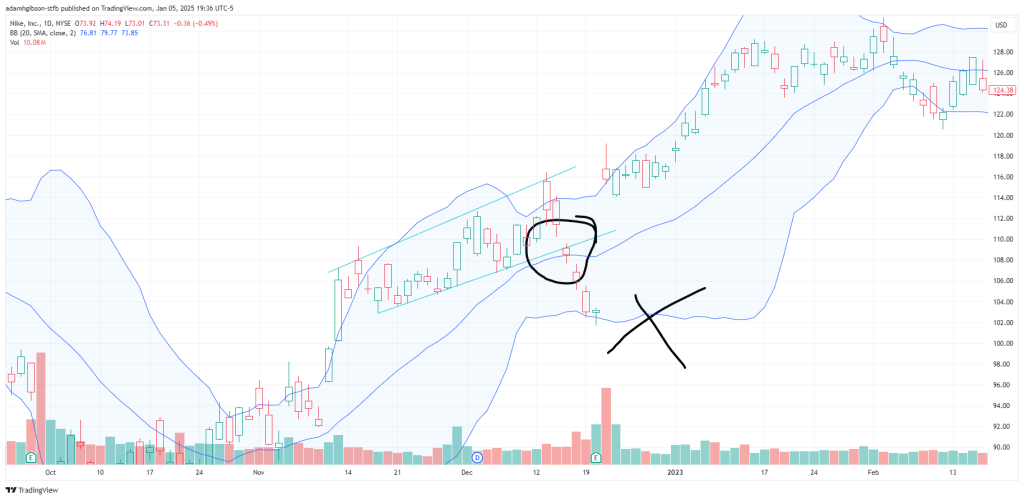 Shown by the chart, acting too quickly based on the signals from the BB and not enough confluence factors can lead to a losing trade very quickly.
To address these limitations, traders should use Bollinger Bands as part of a broader strategy that includes additional technical and fundamental analysis.
Maintaining a disciplined approach and focusing on risk management can further mitigate the challenges posed by these limitations.
Conclusion
Bollinger Bands are a dynamic and flexible tool for analyzing market volatility, identifying overbought or oversold conditions, and anticipating breakouts or reversals.
By adapting to price movements, they provide valuable insights that traders can use to navigate various market conditions.
While Bollinger Bands are not without their limitations, they remain an essential component of any technical analyst’s toolkit. When combined with other indicators and a well-rounded trading strategy, Bollinger Bands can significantly improve trading precision and outcomes.
Whether you are new to trading or an experienced investor, understanding and mastering Bollinger Bands will enhance your ability to make informed, confident decisions in the markets.