Introduction: What is the RSI Indicator?
The Relative Strength Index (RSI) is a popular momentum oscillator used by traders to measure the speed and magnitude of recent price movements. Developed by J. Welles Wilder, the RSI ranges from 0 to 100 and is primarily used to identify overbought or oversold conditions in a stock, helping traders make informed decisions about potential entry and exit points.
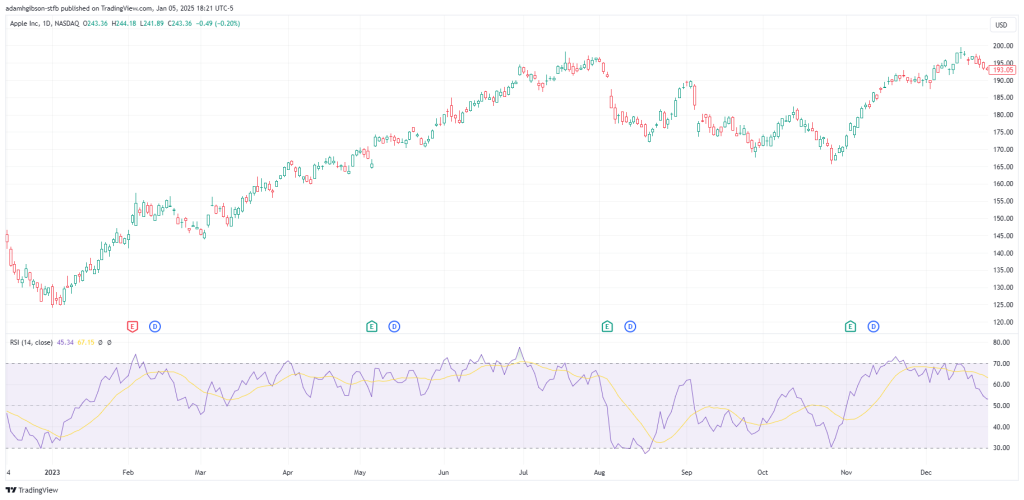 RSI Indicator EX
RSI works by comparing the average gains and losses of a stock over a specified period, typically 14 days, to determine its relative strength. A reading above 70 is generally considered overbought, indicating that a price reversal or pullback may be imminent.
Conversely, a reading below 30 is viewed as oversold, suggesting that the stock may be undervalued and due for a price increase. This straightforward approach makes the RSI an essential tool for beginners aiming to understand market dynamics and execute trades with confidence.
A practical use of the RSI is identifying trade signals based on divergence and trend strength. For instance, when the RSI forms higher lows while the stock’s price forms lower lows, it indicates a potential bullish reversal.
During a bearish trend, the RSI can highlight when a stock is overbought, offering an opportunity to sell. The RSI’s ability to simplify complex market movements into actionable signals makes it a valuable asset for new traders.
How Does the RSI Indicator Work?
The RSI measures the relative strength of a stock’s recent price movements by comparing its average gains to its average losses over a specified period, typically 14 days.
This calculation results in a value between 0 and 100, plotted on a chart. An RSI above 70 suggests that a stock may be overbought, signaling a potential pullback or reversal, while an RSI below 30 indicates it may be oversold and poised for a rebound.
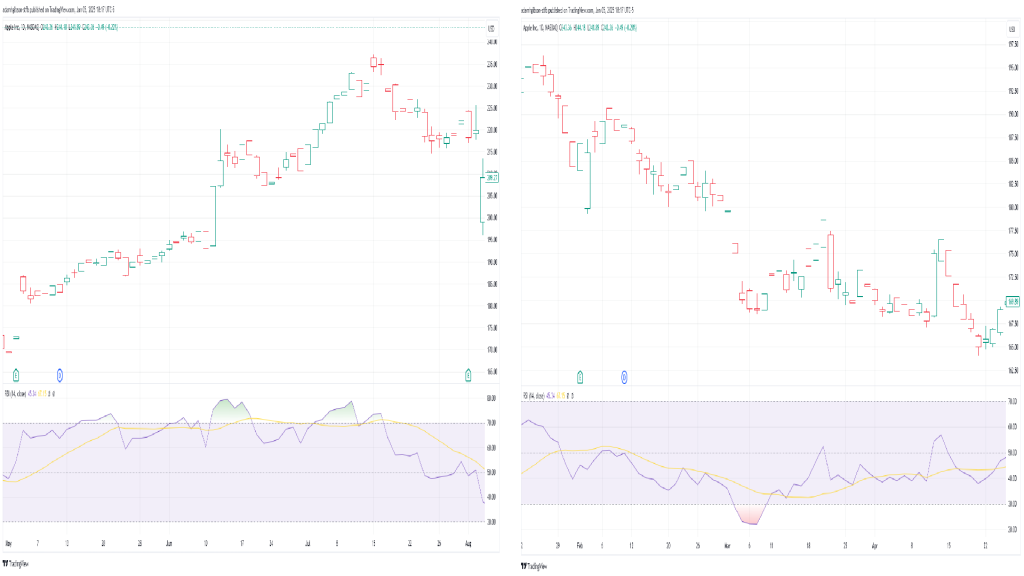 Overbought and Sold
Traders often use these thresholds to identify entry and exit points, but the RSI’s utility doesn’t stop there. It also highlights divergences between price and momentum, which can signal impending trend reversals.
For example, a positive divergence occurs when the RSI forms higher lows even as the stock’s price forms lower lows, suggesting building bullish momentum.
Similarly, a negative divergence, where the RSI forms lower highs while the price forms higher highs, signals weakening bullish momentum and a potential downturn. The simplicity and versatility of the RSI make it a favored tool for both new and experienced traders.
Practical Applications of the RSI Indicator
The RSI is versatile and can be used in various trading strategies. Below are some practical applications…
Identifying Overbought and Oversold Conditions
Stocks with RSI above 70 are considered overbought, signaling a potential pullback or correction. Stocks with RSI below 30 are considered oversold, indicating a potential buying opportunity.
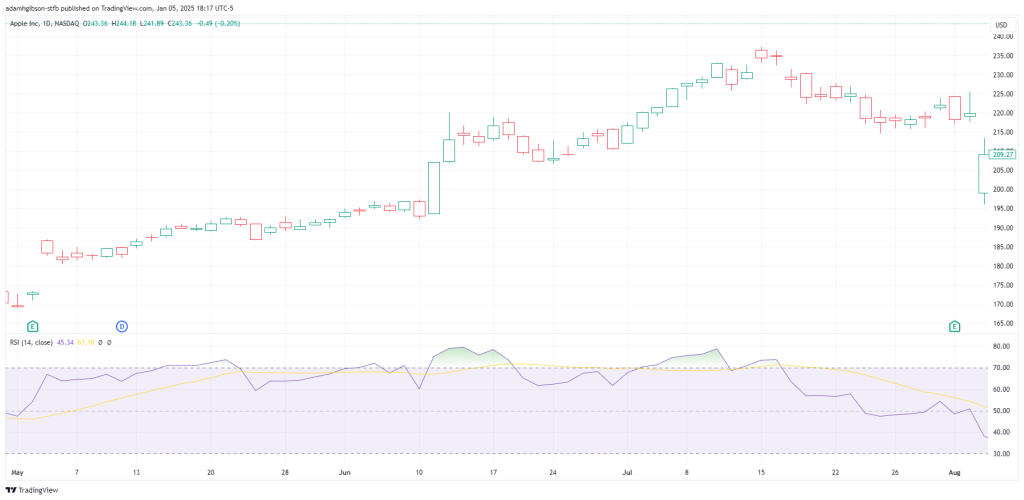 The RSI crossing above the 70 line in the chart depicts what classifies as an Overbought situation for a stock according to the RSI. This is shown by the GREEN area at the top of the RSI indicator.
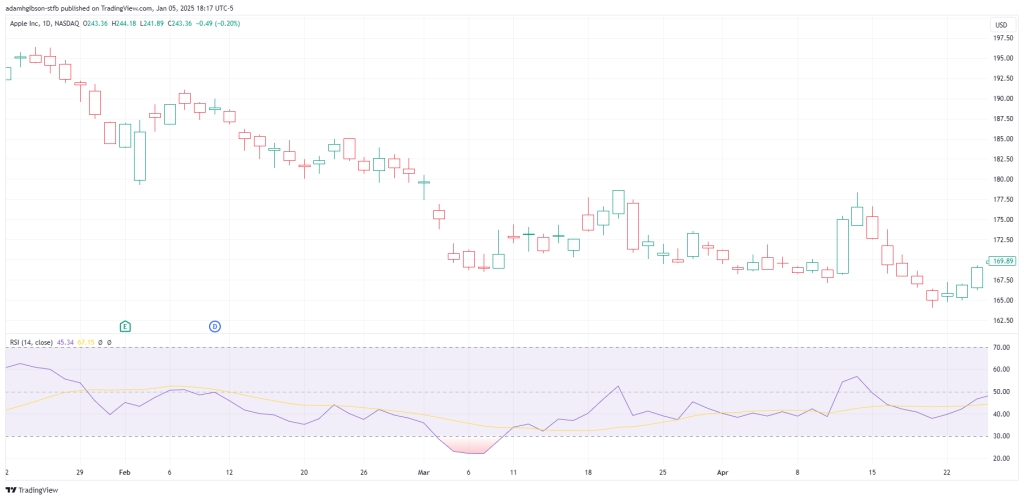 The RSI crossing below the 30 line in the chart depicts what classifies as an Oversold situation for a stock according to the RSI. This is shown by the RED area at the bottom of the RSI indicator.
Spotting Divergences
Positive divergence occurs when the RSI forms higher lows while the price forms lower lows, signaling potential bullish momentum. Negative divergence occurs when the RSI forms lower highs while the price forms higher highs, signaling potential bearish momentum.
Using RSI in Trend Trading
The RSI is particularly effective when paired with the prevailing trend. In a bullish trend, traders focus on bullish signals (e.x., RSI crossing above 30), while in a bearish trend, they focus on bearish signals (e.x., RSI crossing below 70).
RSI for Trade Entry and Exit
- Entry: Use RSI to time entries during pullbacks in an uptrend or rallies in a downtrend.
- Exit: RSI can help identify when a trend is losing momentum, signaling a good time to exit.
Using RSI for Trade Signals
The RSI becomes even more powerful when applied strategically in bullish or bearish trends. Here’s how to use it effectively:
Bullish Signals
When the market is in an uptrend, prices are generally rising. Look for buy signals, such as:
- The RSI crossing above 30, indicating the asset is no longer oversold.
- Positive divergence, where the RSI forms higher lows while the price forms lower lows.
Avoiding False Alarms: Focus on bullish signals during an uptrend to avoid selling prematurely based on temporary price dips that don’t indicate a trend reversal.
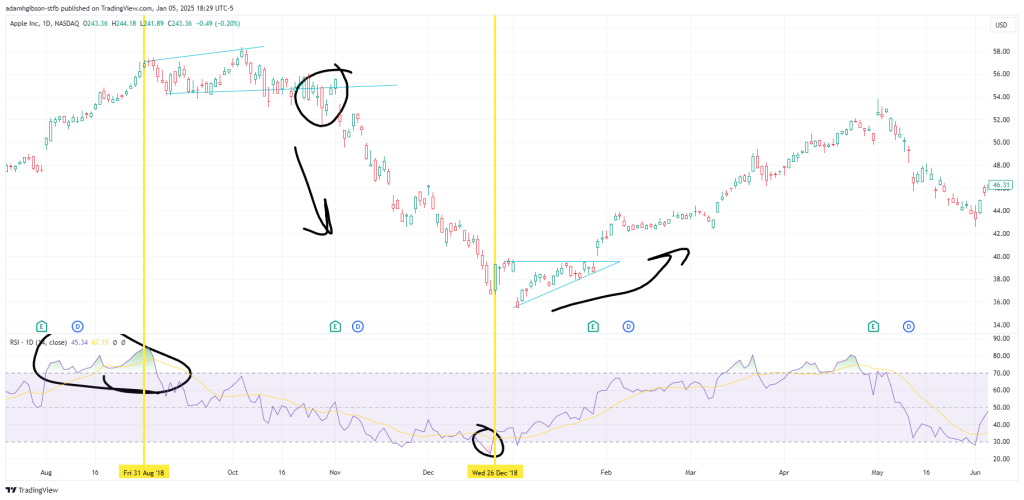 As you can see, after the RSI dropped into an Oversold zone, it rebounded quickly and with the aid of analyzing the chart with some basic patterns, we would have been able to capitalize on a fairly good bullish trend.
Bearish Signals in a Bearish Trend
Bearish Trend
When the market is in a downtrend, prices are generally falling.
Bearish Signals
Look for sell signals, such as:
- The RSI crossing below 70, indicating the asset is no longer overbought.
- Negative divergence, where the RSI forms lower highs while the price forms higher highs.
- Avoiding False Alarms: Focus on bearish signals during a downtrend to avoid buying too early based on temporary price spikes that don’t indicate a trend reversal.
 Still looking at the same chart picture, to the left, we can see where the RSI moved its way into the Overbought zone, also with the aid of utilizing chart patterns, we were able to identify a good bearish trend to capitalize on after price broke the bottom line and the RSI moved back out of the Overbought zone and started trending down.
Tips for Using the RSI Effectively
- Pair RSI with Other Indicators: Combine the RSI with moving averages, MACD, or Bollinger Bands for more reliable signals.
- Adjust the Timeframe: Shorten or lengthen the RSI’s period based on your trading style (e.x., 7 days for short-term trading, 14 days for standard use).
- Focus on the Trend: Align RSI signals with the prevailing market trend for better accuracy.
- Backtest Strategies: Test your RSI-based strategies on historical data to ensure their effectiveness before using them in live trading.
Conclusion: Why RSI is a Powerful Tool for Beginners
The Relative Strength Index is a must-have tool for beginner stock traders, offering valuable insights into market momentum and potential reversals. By identifying overbought and oversold conditions, spotting divergences, and providing actionable trade signals, the RSI empowers traders to make informed decisions with confidence.
When used alongside other indicators and sound risk management practices, the RSI can become an indispensable part of any trading strategy.
Remember, no indicator is foolproof. The key to success lies in combining tools like the RSI with a deep understanding of market trends and disciplined trading practices.
As you gain experience, the RSI will prove to be a reliable ally in navigating the complexities of the stock market.