The world of stock trading is a challenging yet rewarding landscape where the right tools and strategies can make all the difference. One such powerful tool is the Moving Average Convergence Divergence (MACD). Designed to reveal momentum shifts and trends, MACD has become a cornerstone indicator for retail traders worldwide. Whether you’re a day trader chasing quick profits or a swing trader eyeing medium-term opportunities, understanding and leveraging MACD can significantly enhance your trading outcomes.
Introduction and Components of MACD
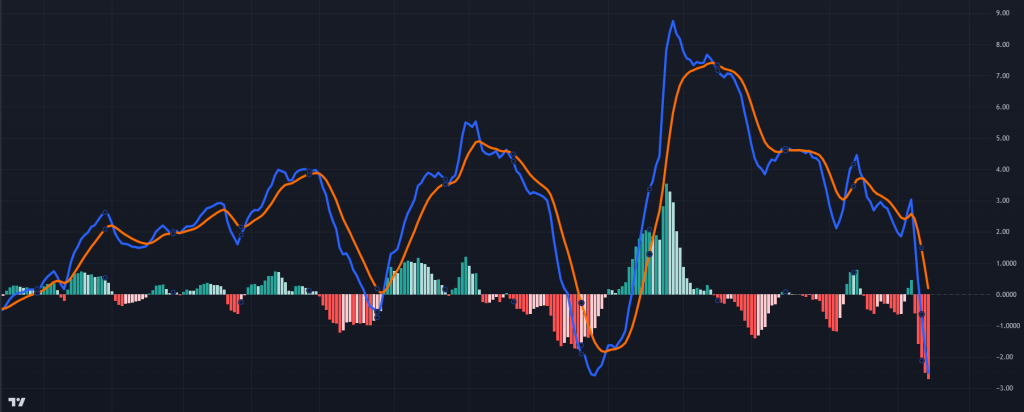 MACD Indicator
What Is MACD? (Understanding the Basics)
The MACD is a momentum-based technical indicator that analyzes the relationship between two exponential moving averages (EMAs). Developed by Gerald Appel in the 1970s, it’s widely used to track price momentum and identify trends. The MACD consists of three key components:
MACD Line: Reflects the short-term momentum compared to long-term trends. A crossover above the signal line indicates a buy, and a crossover below the signal line indicates a sell. The difference between a short-term EMA (typically 12 periods) and a long-term EMA (usually 26 periods). – (indicated by the yellow line).
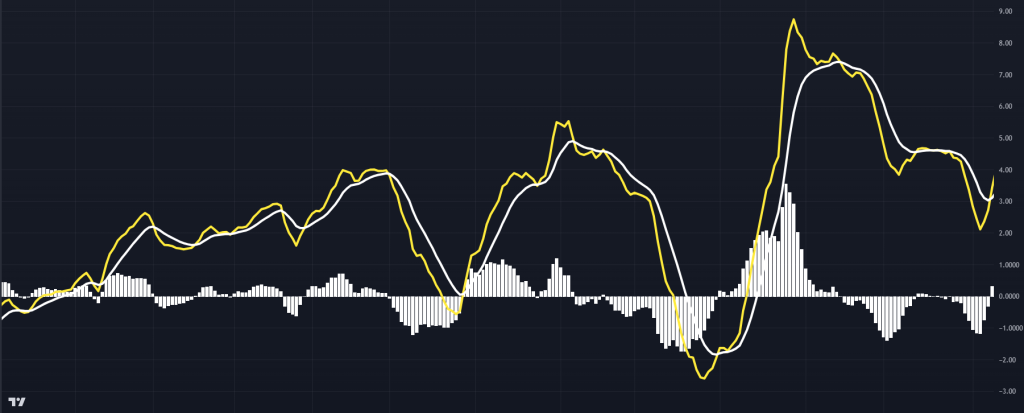 MACD Line
Signal Line: Acts as a trigger for the MACD line to indicate buy and sell signals. A 9-period EMA of the MACD line, serving as a trigger for buy and sell signals. – (indicated by the yellow line)
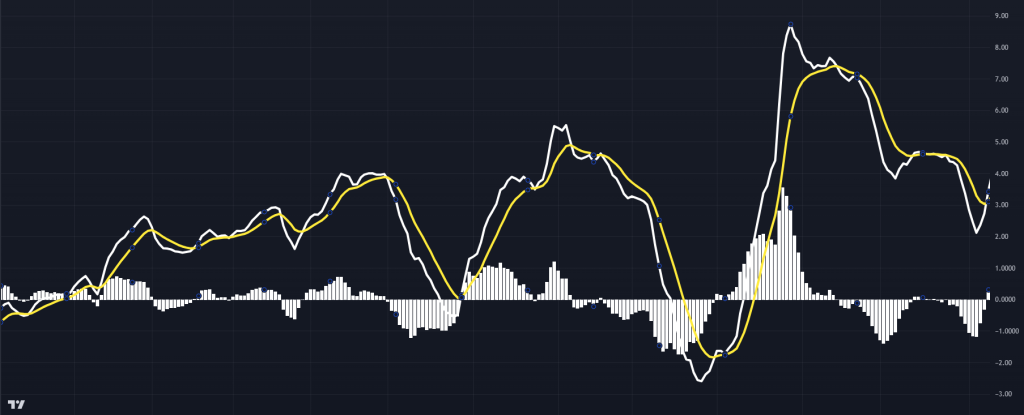 MACD Signal Line
Histogram: Provides a clearer view of momentum strength. Larger bars indicate stronger trends, while smaller bars suggest weakening momentum. When above zero, it signals bullishness; below zero, bearishness. A visual representation of the difference between the MACD line and the signal line, showing the strength of momentum. – (indicated by the yellow histogram)
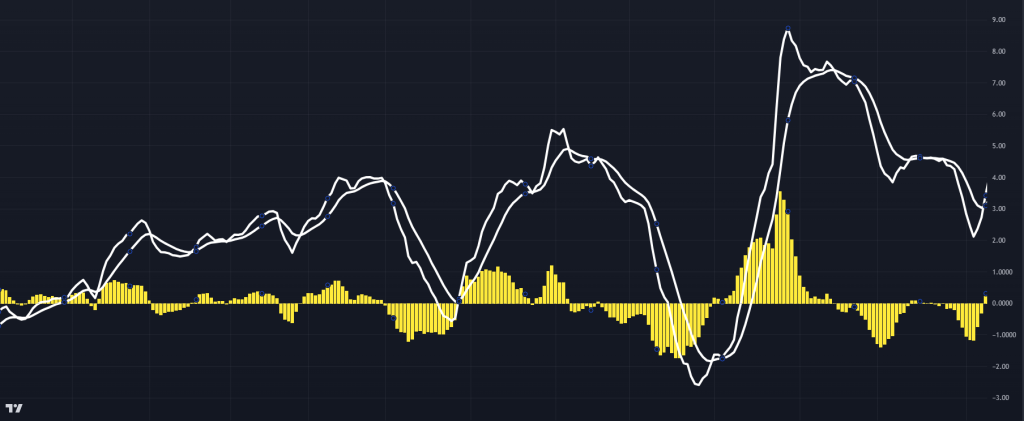 MACD Histogram
When the MACD line crosses above the signal line, it suggests bullish momentum, while a cross below indicates bearish momentum. This trio enables traders to spot entry and exit points effectively.
MACD in Day Trading
Using MACD for Quick Decisions
Day traders benefit from MACD’s ability to highlight short-term momentum changes. Key strategies include:
Crossovers: Buying when the MACD line crosses above the signal line and selling when it crosses below.
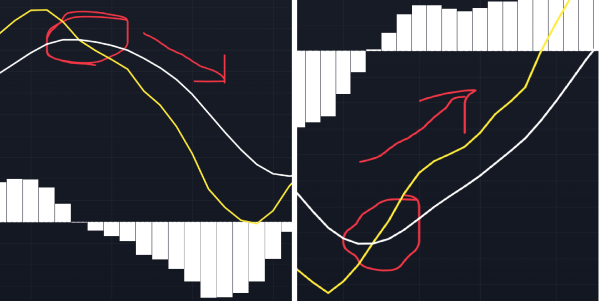 MACD Crosses
Histogram Analysis: Monitoring increasing bars for strengthening trends or decreasing bars for weakening trends.
Day trading demands swift decision-making, and MACD provides timely insights when used alongside other indicators like volume.
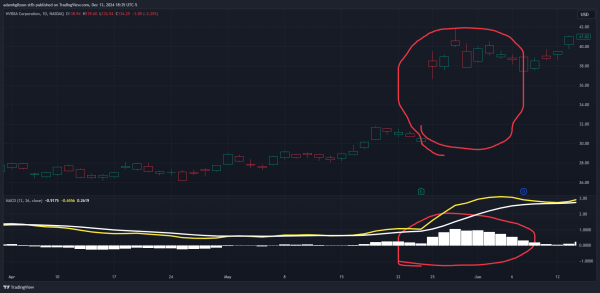 MACD Histogram Analysis
Price Action Analysis: becomes an incredibly useful tool when utilized in conjunction with price action analysis.
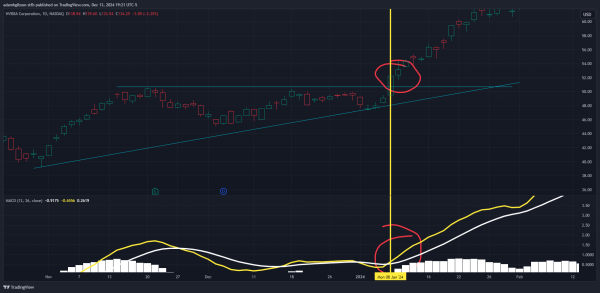 MACD Price Action
Swing Trading with MACD
Swing trading, which involves holding positions for several days or weeks, is an effective strategy for capturing short- to medium-term market trends. The MACD (Moving Average Convergence Divergence) indicator is a powerful tool for identifying momentum and detecting potential trend continuations or even reversals.
For example, divergences between price action and the MACD often signal an impending trend reversal, while analyzing the indicator on daily or weekly charts can offer more reliable and actionable insights for seeing the bigger picture of the overall trend in the market.
Many swing traders enhance their strategy by combining MACD signals with support and resistance levels to confirm potential entry and exit points. This combination of momentum and price action analysis make MACD a versatile and essential tool for swing traders aiming to improve their trading decision-making and maximize profits.
Advanced MACD Strategies
Advanced MACD strategies often involve customizing the indicator’s settings to better align with specific trading goals and timeframes. For short-term trading, using settings like 5, 13, and 9 for the MACD’s EMAs provides faster, more reactive signals, making it ideal for capturing quick price movements.
Conversely, long-term traders may opt for settings like 15, 30, and 9 to smooth out the indicator, reducing noise and focusing on broader market trends. These tailored adjustments help traders optimize the MACD for their preferred style, whether it’s scalping intraday, swing trading, or long-term trading.
By customizing the MACD settings, traders can enhance its accuracy and relevance to their unique strategies.
Customizing Settings
- Short-Term Adjustments: For quicker signals, use settings like 5, 13, and 9 for EMAs.
- Long-Term Adjustments: Setting adjustments of 15, 30, and 9 better smoothens the MACD for long-term trend analysis.
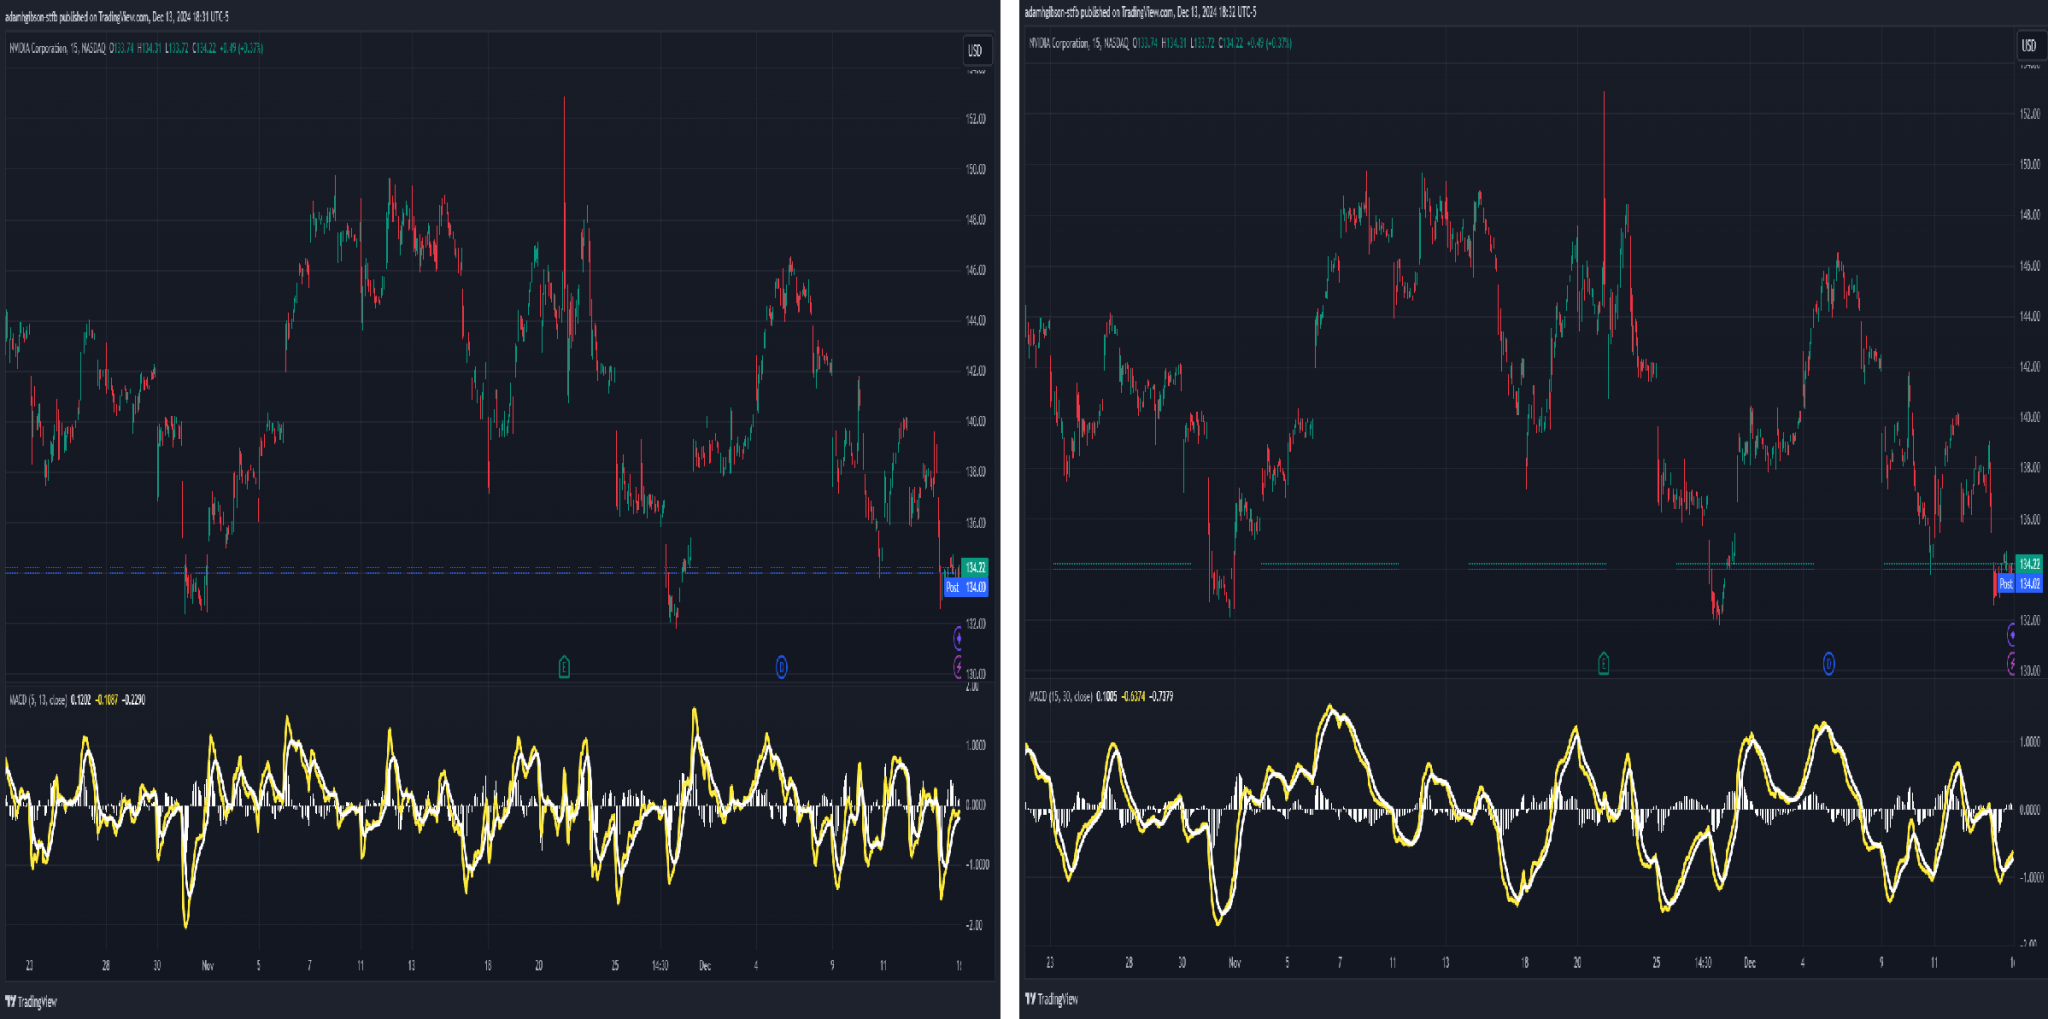 MACD Fast and Slow Signals. The more reactive signals are shown on the left, displaying faster MACD signals. The less reactive signals are shown on the right, displaying slower MACD signals.
MACD in Trending and Range-Bound Markets
- Trending Markets: Use MACD crossovers and histogram growth to ride the momentum.
- Range-Bound Markets: Look for MACD signals near support and resistance to capitalize on smaller movements or know to stay out of the market all together.
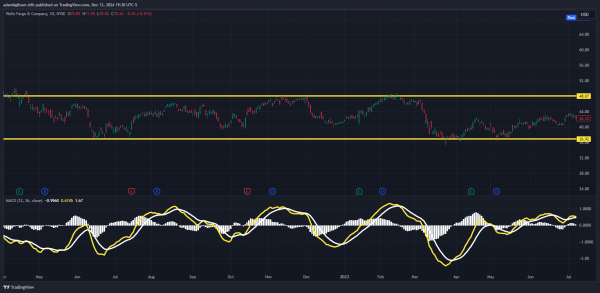 MACD Range Market. We can see that even though the MACD had signals to get in a trade, price never broke out of its range, thus we know to stay out of any trades.
Adapting these strategy approaches based on market conditions enhances the MACD’s reliability.
Risk Management with MACD
Risk management is a crucial component of successful trading, and the MACD indicator can play an integral role in developing effective strategies. Traders can utilize MACD signals to set stop-loss orders, such as positioning them near recent swing highs or lows around crossover points, to limit potential losses while giving trades room to develop.
This will help with preventing traders from getting “stomped” out the trade early and missing out on what could’ve been a good profit opportunity.
Additionally, volatility-based position sizing—adjusting trade size in relation to the strength of MACD momentum—helps traders maintain better control over their overall risk exposure. Incorporating favorable risk-reward ratios, ideally 1:1.5 or 1:2, based on MACD signals ensures that the potential reward outweighs the risk in every trade.
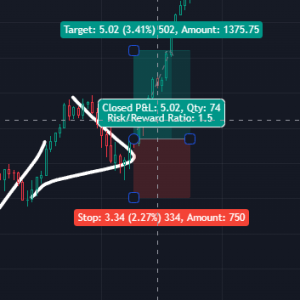 Risk/ Reward Ratio of 1:1.5
This disciplined approach not only minimizes losses but also supports consistent long-term profitability. By integrating MACD into stop-loss placement, position sizing, and risk-reward planning, traders can enhance their risk management framework. Ultimately, using the MACD for these purposes ensures a structured and disciplined trading strategy that balances risk with reward.
Common Pitfalls in MACD Trading
While the MACD is a powerful tool for identifying trends and momentum, relying on it exclusively can lead to poor trading decisions. It should always be used alongside other technical tools like support and resistance levels, trendlines, and price action for a more comprehensive market view.
Additionally, the MACD’s effectiveness is enhanced when its signals are considered in the context of the broader market environment, including news events, press releases, shifts in market sentiment, and other economic factors that may impact price movements.
Ignoring this context can lead to misinterpretation of MACD signals and missed opportunities. Furthermore, a well-defined MACD-based strategy can help traders avoid the pitfalls of emotional trading, such as acting impulsively out of fear or greed, ensuring more disciplined and rational decision-making.
Real-World Applications of MACD
The MACD indicator has proven its value in real-world trading by helping traders identify clear, actionable opportunities. Successful trades often highlight the importance of combining a bullish MACD crossover with other factors, such as key support levels or alignment with broader market trends, to increase the probability of favorable outcomes.
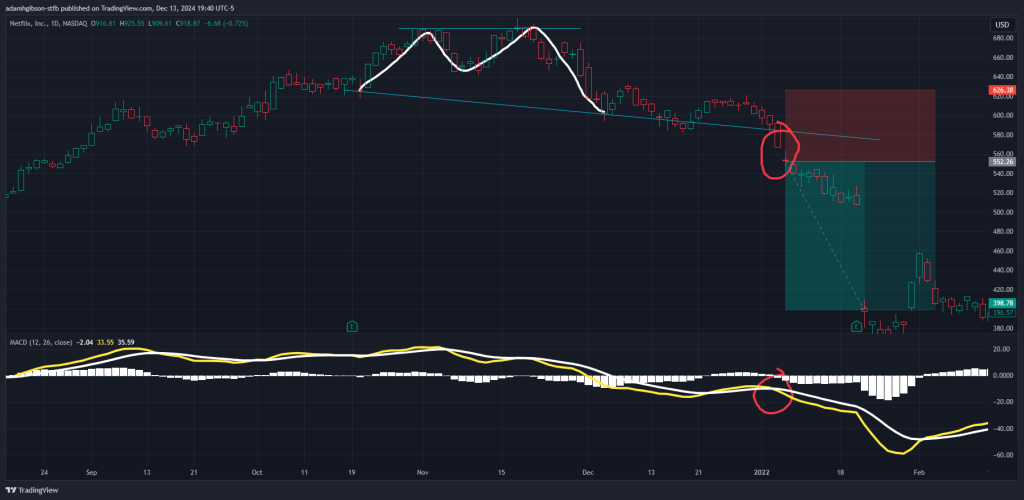 MACD Real World Application. A double top pattern is shown, indicating a reversal in price as the MACD also confirms this soon to be bearish momentum.
However, analyzing failed trades is equally critical for improving trading strategies. One common pitfall is relying solely on MACD signals without considering additional confirmation tools, such as volume or price action, which can lead to false signals and losses.
By learning from these mistakes and integrating MACD with broader market analysis, traders can enhance their effectiveness and make more informed decisions.
Developing a Personal Trading Plan with MACD
A robust trading plan tailored to MACD should include:
- Clear Entry/Exit Rules: Based on MACD crossovers, divergences/ convergences, or histogram analysis.
- Risk Management: Defined stop-loss levels and position sizes.
- Continuous Evaluation: Maintain a trading journal to track MACD performance and identify areas for improvement.
Conclusion: Mastering the MACD for Trading Success
The MACD indicator is a versatile tool that can greatly enhance your trading strategies. By understanding its components, applying it to various trading styles, and incorporating robust risk management techniques, you can navigate the complexities of the market with confidence.
Remember, successful trading requires continuous learning and disciplined execution. With practice and persistence, you can harness the full potential of MACD to achieve your trading goals.